
Flywire (FLYW) Draws Analyst Attention, Is The Stock Fully Valued?
Analyst focus on Flywire’s growth and cash generation
Fresh analyst commentary around Flywire (FLYW) is centering on its 33.9% average billings growth over the past year and a projected 17.1% revenue increase over the coming 12 months.
On the market, Flywire’s share price has climbed 32.5% year to date to US$18.42, supported by a 46.7% total shareholder return over the past 12 months. However, the 3 year and 5 year total shareholder returns remain deeply negative, which suggests current momentum is building from a lower base rather than reflecting a long winning streak.
Compare Flywire’s momentum and cash generation with other payment and fintech platforms by screening for 20 high quality undiscovered gems that are still flying under most investors’ radar.
Bulls point to Flywire’s billings surge and cash generation. Bears point to the long stretch of weak multi year returns. Which case do the current valuation markers lean toward next?
Most Popular Narrative: 10% Undervalued
Against Flywire’s last close at $18.42, the most followed narrative pegs fair value around $20.38, which frames today’s rally as still leaving some upside implied by that framework.
Ongoing investment in proprietary technology, AI-driven automation, and integration capabilities is yielding significant platform efficiencies (for example, 25% operational cost improvements, 90% automated payment matching, and 40% automated customer service). This underpins Flywire's ability to maintain or increase net margins and deliver stronger earnings leverage as scale increases.
See why 9 investors see Flywire as 10% undervalued.
Result: Fair Value of $20.38 (UNDERVALUED)
Still, Flywire’s story can be knocked off course if regulatory pressure on cross border education payments ramps up, or if competition squeezes transaction margins harder than expected.
Find out about the key risks to this Flywire narrative.
Another view on Flywire’s valuation
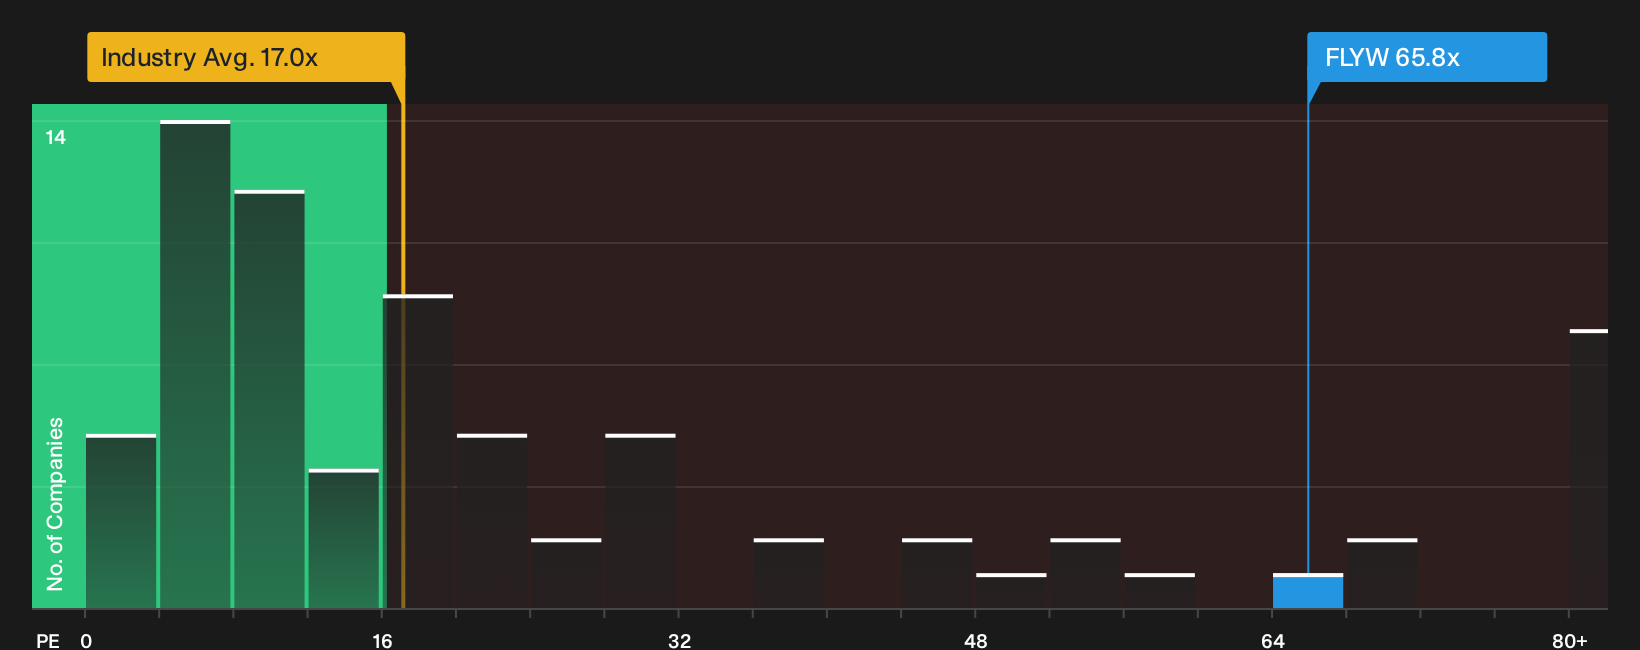
On simple P/E math, Flywire looks expensive. The stock trades on about 65.8x earnings compared with 16.9x for the US Diversified Financial industry and 36.1x for its peer group, while the fair ratio is flagged at 21.3x, which points to real valuation risk if sentiment cools.
To pressure test that, it helps to see what the market is paying for the underlying earnings profile. This is where See what the numbers say about this price — find out in our valuation breakdown..
Visualising how Flywire’s multiple stacks up against sector peers can sharpen that view. It is worth lining it up on a simple comparison chart like
Next Steps
The Flywire story so far sends mixed messages. If that leaves you undecided, move quickly from headline impressions to hard numbers with 3 key rewards and 1 important warning sign.
Looking for more Flywire investment ideas?
If Flywire has your attention but you want a wider watchlist, do not sit on your hands while other opportunities line up for capital.
- Target dependable compounding by scanning companies that pair strong fundamentals with healthy balance sheets through the list of solid balance sheet and fundamentals (25 results).
- Hunt for value by focusing on quality businesses that screens highlight as attractively priced with the 29 high quality undervalued stocks.
- Prioritise sleep-at-night holdings by zeroing in on resilient stocks that carry lower risk scores using the 31 resilient stocks with low risk scores.
This article by Simply Wall St is general in nature. We provide commentary based on historical data and analyst forecasts only using an unbiased methodology and our articles are not intended to be financial advice. It does not constitute a recommendation to buy or sell any stock, and does not take account of your objectives, or your financial situation. We aim to bring you long-term focused analysis driven by fundamental data. Note that our analysis may not factor in the latest price-sensitive company announcements or qualitative material. Simply Wall St has no position in any stocks mentioned.
Have feedback on this article? Concerned about the content? Get in touch with us directly. Alternatively, email editorial-team@simplywallst.com