
Angelalign Technology (SEHK:6699) Rolls Out Pressure Points In Europe But Is The Valuation Too Rich
Angelalign Technology (SEHK:6699) is back on investors’ radar after the company introduced its new Pressure Points feature in Europe, replacing Torque Ridges in its clear aligner system.
The Pressure Points launch lands as Angelalign Technology’s share price sits at HK$82.05, with a 90-day share price return of 9.25% and a year-to-date share price gain of 34.73%. This feeds into a 1-year total shareholder return of 49.24%, which contrasts with a much weaker 5-year total shareholder return and suggests that momentum has picked up recently despite earlier long-term share price pressure.
Compare Angelalign Technology's move with a hand picked 125 healthcare AI stocks that are also trying to turn clinical research into real traction on the chart.
Bulls see Angelalign Technology’s product refresh and 1 year rebound as the start of a reset. Bears see a bounce inside a bruised 5 year chart. Which case does the current valuation support?
Price-to-Earnings of 43.5x: Is it justified?
Angelalign Technology’s valuation is currently framed by a P/E of 43.5x, which sits well above both its direct peers and the wider Hong Kong medical equipment group. The last close at HK$82.05 means investors are paying a premium multiple for each unit of reported earnings.
The P/E ratio compares the share price with earnings per share. For a healthcare equipment business like Angelalign Technology, that figure often reflects how much faith the market has in the durability of profit growth and cash generation rather than just the latest set of numbers.
In this case, the premium is clear. The stock trades on 43.5x earnings, while the Hong Kong medical equipment industry sits at 19.2x and the peer group average is 20x. The estimated fair P/E of 18.7x is also far below the current level, which points to a valuation that could move closer to that fair ratio if sentiment cools.
Explore the SWS fair ratio for Angelalign Technology.
Result: Price-to-Earnings of 43.5x (OVERVALUED)
Still, Angelalign Technology’s high P/E leaves little room for execution missteps, and any slowdown in annual revenue or net income growth could quickly challenge the reset story.
Find out about the key risks to this Angelalign Technology narrative.
Another view on Angelalign Technology’s value
The high P/E tells one story. The SWS DCF model tells another, with an estimated future cash flow value of HK$134.94 per share against the current HK$82.05 price, which suggests Angelalign Technology could be undervalued. Which signal do you trust more: earnings multiples or cash flows?
Look into how the SWS DCF model arrives at its fair value.
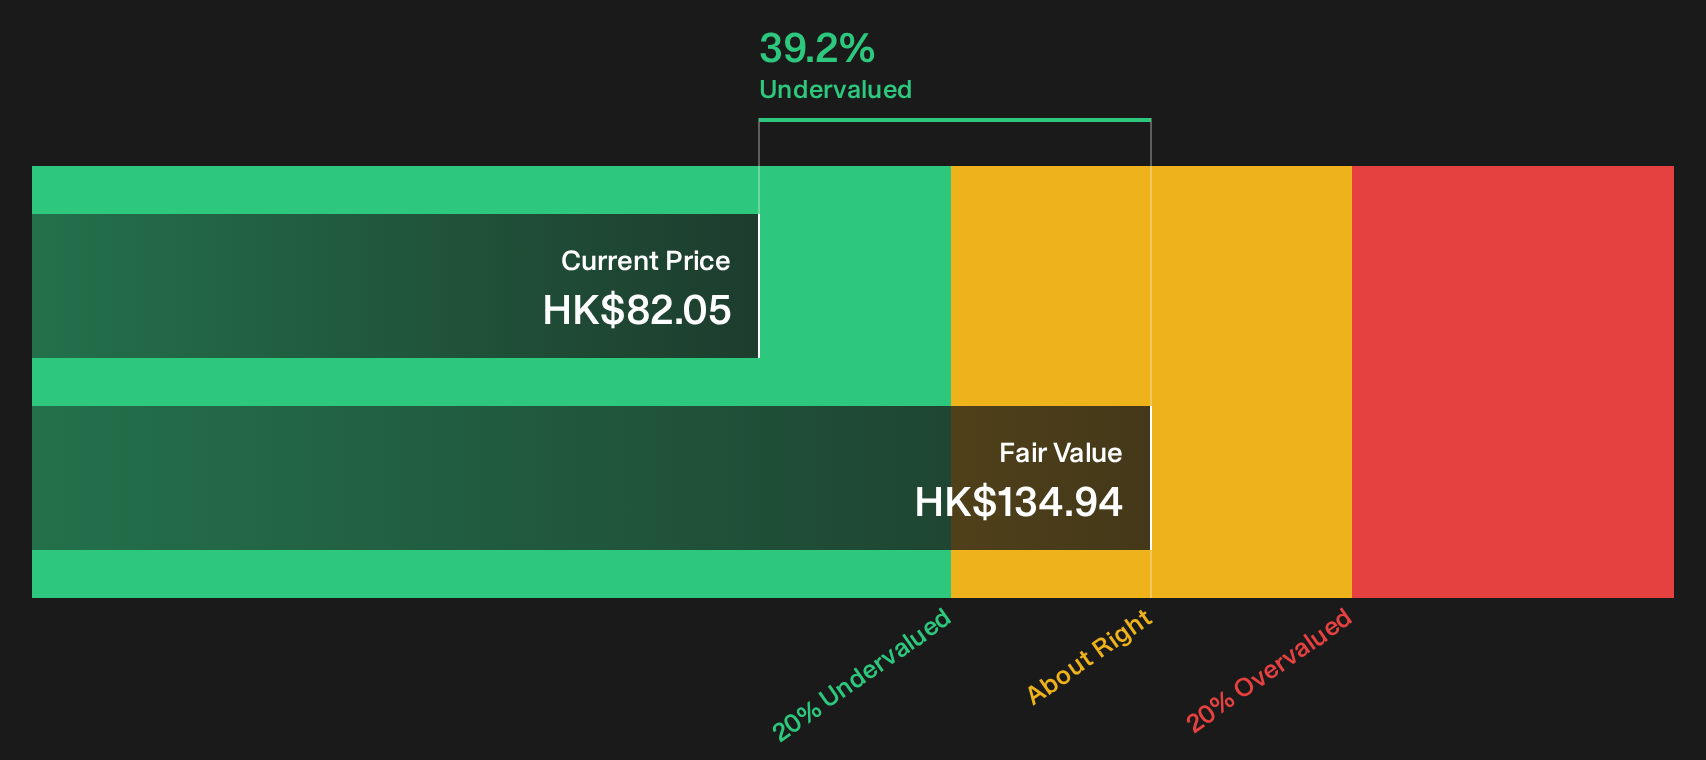
Simply Wall St performs a discounted cash flow (DCF) on every stock in the world every day (check out Angelalign Technology for example). We show the entire calculation in full. You can track the result in your watchlist or portfolio and be alerted when this changes, or use our stock screener to discover 181 high quality undervalued stocks. If you save a screener we even alert you when new companies match - so you never miss a potential opportunity.
Next Steps
Mixed views on whether Angelalign Technology’s rebound has real staying power or just reflects a hot narrative right now. Move quickly on reviewing the data, examine both the potential upside and the red flags, and ground your own stance in the 4 key rewards and 2 important warning signs.
Looking for more Angelalign Technology style investment ideas?
If Angelalign Technology has you thinking harder about where you put fresh capital, do not stop here. Use the tools built for finding your next edge.
- Target potential value opportunities by scanning a 181 high quality undervalued stocks that combines quality fundamentals with prices that may not yet fully reflect them.
- Strengthen your core holdings by reviewing a list of solid balance sheet and fundamentals (203 results) that prioritises robust finances and resilient business profiles.
- Get ahead of the crowd by tracking a 620 high quality undiscovered gems that focuses on under-the-radar companies with strong underlying metrics.
This article by Simply Wall St is general in nature. We provide commentary based on historical data and analyst forecasts only using an unbiased methodology and our articles are not intended to be financial advice. It does not constitute a recommendation to buy or sell any stock, and does not take account of your objectives, or your financial situation. We aim to bring you long-term focused analysis driven by fundamental data. Note that our analysis may not factor in the latest price-sensitive company announcements or qualitative material. Simply Wall St has no position in any stocks mentioned.
Have feedback on this article? Concerned about the content? Get in touch with us directly. Alternatively, email editorial-team@simplywallst.com