
DCM Holdings (TSE:3050) Could Be 45% Undervalued Following Earnings And Dividend Lift
DCM Holdings earnings and dividend move come into focus
DCM Holdings (TSE:3050) just paired its half year results with a slightly higher second quarter dividend, putting both profit trends and cash returns to shareholders on the table for closer inspection.
Recent trading has been mixed. The share price is around ¥1,550 after a 1-day share price return of 2.11% and a 90-day gain of 4.52%. However, the year-to-date share price return is down 4.73%, while the 1-year total shareholder return of 10.71% and 3-year total shareholder return of 42.13% point to momentum that has built over a longer stretch as DCM Holdings pairs earnings with a slightly higher dividend.
Scan how DCM Holdings compares with other retailers returning cash to shareholders by running through our hand-picked 27 dividend fortresses in the same space.
Bulls see DCM Holdings pairing higher sales with a rising dividend, while bears point to softer earnings per share. Which story does the valuation actually reflect next?
Preferred P/E multiple of 12.6x for DCM Holdings: Is it justified?
DCM Holdings trades on a P/E of 12.6x, which puts a clear price tag on its earnings relative to both its own cash flow profile and peers in Japanese specialty retail.
The P/E ratio compares the current share price with earnings per share and gives you a quick yardstick for how much investors are willing to pay for each unit of profit. For a retailer like DCM Holdings, where earnings and cash generation matter more than high growth promises, that yardstick often becomes a primary reference point.
Against its direct industry, that 12.6x P/E is slightly lower than the JP Specialty Retail average of 13.1x, yet it sits a touch higher than the peer group average of 12.5x mentioned in the data. The SWS fair ratio work suggests a P/E of 14.4x that could be more aligned with the underlying fundamentals, which is a higher level that the market could move toward if sentiment and earnings delivery stay in sync with that view.
Explore the SWS fair ratio for DCM Holdings.
Result: Price-to-earnings of 12.6x (ABOUT RIGHT)
Still, softer earnings per share and only modest annual revenue growth of 0.26% leave the DCM Holdings story vulnerable if profitability comes under pressure.
Find out about the key risks to this DCM Holdings narrative.
Another view on DCM Holdings using our DCF model
The P/E story for DCM Holdings looks fairly ordinary. The SWS DCF model tells a different story. With the share price at around ¥1,550 versus an estimated future cash flow value of ¥2,246.08, the model points to a meaningful gap that long term investors will need to interpret. Is this a mispricing or a warning signal the simple ratio is missing?
Look into how the SWS DCF model arrives at its fair value.
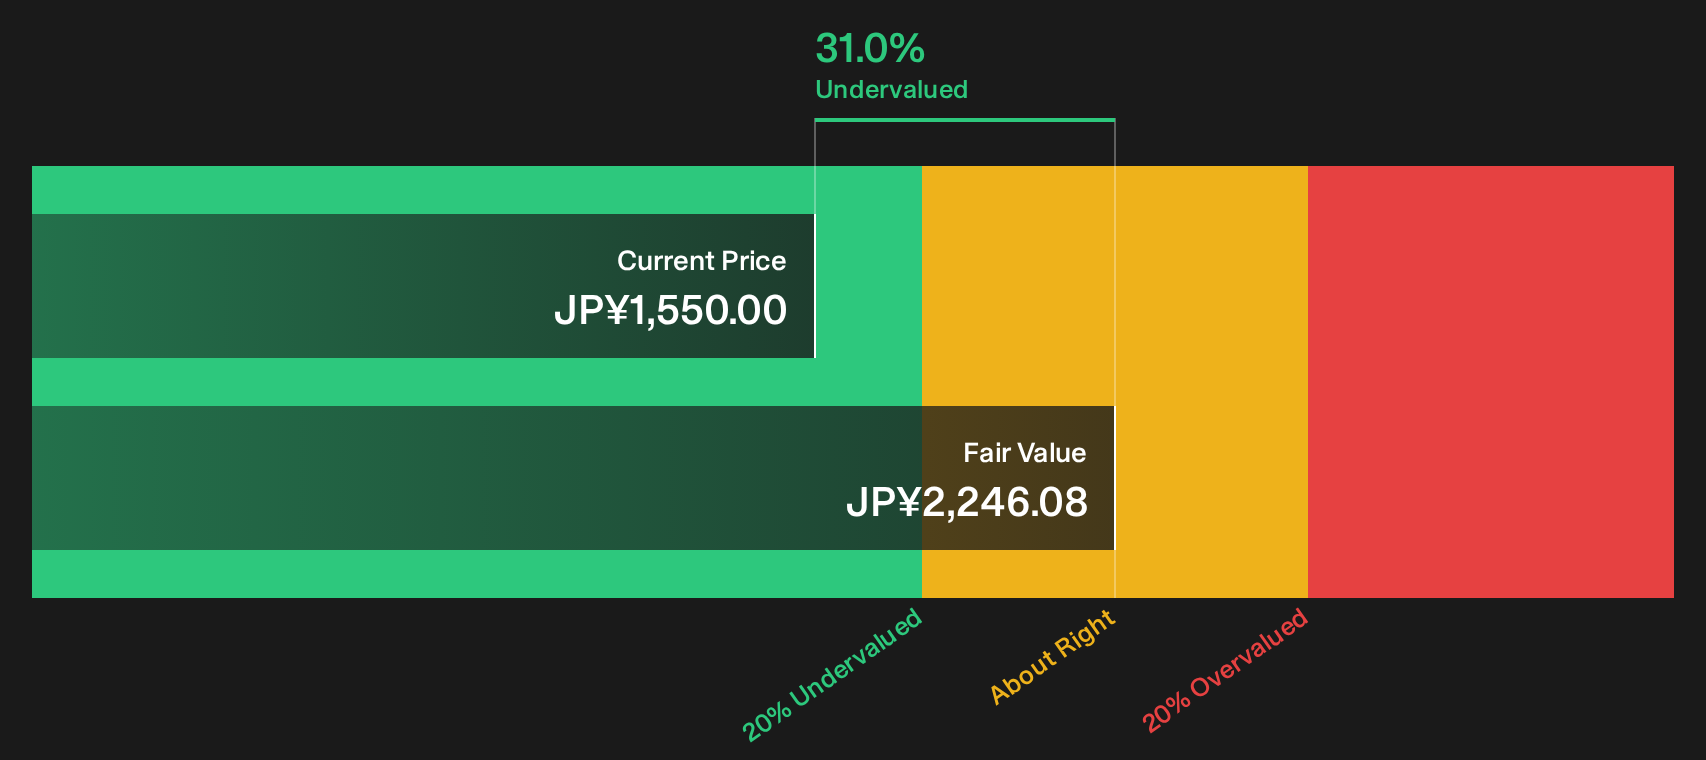
Simply Wall St performs a discounted cash flow (DCF) on every stock in the world every day (check out DCM Holdings for example). We show the entire calculation in full. You can track the result in your watchlist or portfolio and be alerted when this changes, or use our stock screener to discover 12 high quality undervalued stocks. If you save a screener we even alert you when new companies match - so you never miss a potential opportunity.
Next Steps
Mixed signals on DCM Holdings so far. If you want a clear picture, move quickly, review both sides of the story, and weigh the 2 key rewards and 2 important warning signs.
Looking for more DCM Holdings investment ideas?
If DCM Holdings has sharpened your focus, do not stop here. Broader ideas can help you stress test your thinking and spot opportunities competitors may miss.
- Kick start a search for quality at a discount by scanning our 12 high quality undervalued stocks that filters for companies combining stronger fundamentals with attractive pricing.
- Strengthen your capital preservation toolkit by reviewing a 23 resilient stocks with low risk scores that highlights businesses with more resilient profiles and lower overall risk scores.
- Get ahead of the crowd by checking a 74 high quality undiscovered gems focused on financially solid companies that have not yet drawn widespread market attention.
This article by Simply Wall St is general in nature. We provide commentary based on historical data and analyst forecasts only using an unbiased methodology and our articles are not intended to be financial advice. It does not constitute a recommendation to buy or sell any stock, and does not take account of your objectives, or your financial situation. We aim to bring you long-term focused analysis driven by fundamental data. Note that our analysis may not factor in the latest price-sensitive company announcements or qualitative material. Simply Wall St has no position in any stocks mentioned.
Have feedback on this article? Concerned about the content? Get in touch with us directly. Alternatively, email editorial-team@simplywallst.com