
OSG (TSE:6136) After Raised Guidance And Dividend Looks Fully Valued
OSG (TSE:6136) has landed on investors’ screens after management raised full year earnings guidance and lifted the projected year end dividend, pairing stronger forecasts with a more generous cash return profile.
That guidance shift arrives after a strong run in OSG’s share price, with a 1 month share price return of 14.16% and a year to date share price gain of 68.27% at a closing price of ¥3,861. Over a longer horizon, momentum has also been favourable, with a 1 year total shareholder return of 81.93% and a 5 year total shareholder return of 149.61%, suggesting investors have been steadily repricing the stock as expectations and perceived risk have evolved.
Spot similar momentum stories by scanning our hand picked 74 high quality undiscovered gems, which pair earnings upgrades, shareholder returns, or both with under-the-radar small and mid caps.OSG now appears to be a stronger business on paper after upgraded guidance, higher dividends, and a new buyback plan. The open question is whether that quality is already fully reflected in today’s share price.
Preferred P/E of 12.2x for OSG: Is it justified?
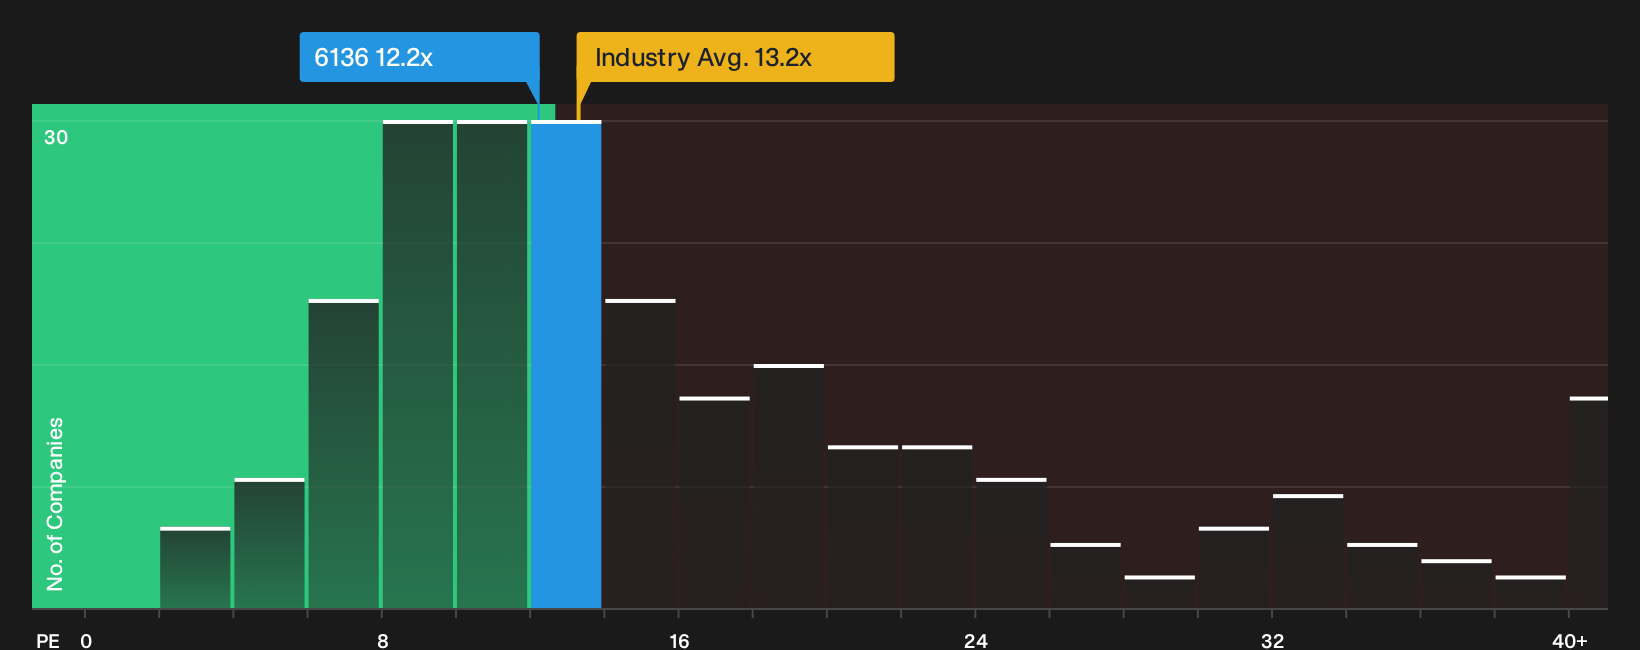
On traditional valuation, OSG trades on a P/E of 12.2x at a share price of ¥3,861, which screens cheaper than both the wider Japanese market and its Machinery peers but still above the SWS DCF estimate of future cash flow value.
The P/E ratio compares what you pay per share to the earnings that each share currently generates. It is a common way to benchmark mature industrial groups that already produce consistent profits. For a tooling specialist like OSG, this measure links directly to how reliably the business converts its established product portfolio and reconditioning services into bottom line income.
There is a tension in the signals. On one side, the stock is flagged as good value because its 12.2x P/E is below the Japanese market at 13.8x and below the Machinery industry at 13.2x. This points to a discount where the market may be pricing in softer earnings ahead. On the other side, the same 12.2x multiple is described as expensive versus an estimated fair P/E of 10.8x. This is a level the market could move towards if investors lean more heavily on the current fair ratio work rather than peer comparisons.
Relative to the Machinery sector, the lower P/E suggests investors are not paying a premium for OSG even after its recent share price strength. The gap versus the fair ratio indicates the stock is not being given full credit on that basis either.
Explore the SWS fair ratio for OSG.
Result: Price-to-Earnings of 12.2x (OVERVALUED).
Still, OSG’s recent share price strength and a reported annual decline in net income of 6.10% leave little room for disappointment if demand or profitability softens further.
Find out about the key risks to this OSG narrative.
Another view on OSG’s valuation
While the 12.2x P/E makes OSG look inexpensive next to Machinery peers at 13.2x and a broader peer set at 16.4x, the fair ratio of 10.8x suggests the market might be paying up relative to where that multiple could settle. That gap raises the risk that valuation compresses if sentiment cools.
For investors who want to stress test that conclusion against a different framework, it is worth walking through a more detailed breakdown of how this price compares with earnings, sector norms, and the fair ratio work in one place. See what the numbers say about this price — find out in our valuation breakdown.
Simply Wall St performs a discounted cash flow (DCF) on every stock in the world every day (check out OSG for example). We show the entire calculation in full. You can track the result in your watchlist or portfolio and be alerted when this changes, or use our stock screener to discover 13 high quality undervalued stocks. If you save a screener we even alert you when new companies match - so you never miss a potential opportunity.
Next Steps
Mixed signals around OSG’s valuation and fundamentals make this a moment to move fast, study the underlying data, and decide where you stand. To see both sides of the story in one place, start with our breakdown of 2 key rewards and 2 important warning signs
Looking for more ideas beyond OSG?
Do not stop with OSG alone. Use this momentum to widen your watchlist and line up a few more potential opportunities before the market moves on.
- Target resilient cash generators by scanning a list of solid balance sheet and fundamentals (21 results) that can help anchor your portfolio when sentiment cools.
- Hunt for better value by reviewing a 13 high quality undervalued stocks that combine quality fundamentals with pricing that still looks reasonable.
- Stack the odds toward steadier payouts by focusing on 27 dividend fortresses that aim to pair higher yields with more robust financials.
This article by Simply Wall St is general in nature. We provide commentary based on historical data and analyst forecasts only using an unbiased methodology and our articles are not intended to be financial advice. It does not constitute a recommendation to buy or sell any stock, and does not take account of your objectives, or your financial situation. We aim to bring you long-term focused analysis driven by fundamental data. Note that our analysis may not factor in the latest price-sensitive company announcements or qualitative material. Simply Wall St has no position in any stocks mentioned.
Have feedback on this article? Concerned about the content? Get in touch with us directly. Alternatively, email editorial-team@simplywallst.com