
RLI (RLI) Reshuffles Leadership As Investors Weigh Its Valuation Story
RLI (RLI) has shuffled its leadership bench, elevating long serving insiders into broader finance, administration and litigation roles. For investors, the focus now turns to how this internal reset shapes future execution.
RLI’s recent promotions come at a time when its share price has slipped over longer periods while still showing brief bursts of strength. The stock’s 1-day and 7-day share price returns of 1.65% and 0.98% are set against a year to date decline of 9.36% and a 1-year total shareholder return that is down 3.18%, with the 5-year total shareholder return up 38.98%.
Scan how RLI compares with other insurance specialists by reviewing a curated set of 31 resilient stocks with low risk scores that aim to balance operational resilience with controlled downside.
RLI now trades only slightly below one set of estimated fair value gauges after a choppy run and a long term gain that still sits in positive territory. Does that balance of setback and resilience still reward new risk takers at this price?
Most Popular Narrative: 6% Undervalued
The most followed storyline around RLI pegs fair value at $60.50, modestly above the last close of $56.63. This points to a small valuation gap that depends on how key risks and supports develop.
The main factor that would need to hold is that RLI sustains its underwriting discipline and service- and technology-supported risk selection, while managing higher expenses and softer property and casualty pricing without eroding its historically strong combined ratios.
See why 3 investors see RLI as 6% undervalued.
Result: Fair Value of $60.50 (UNDERVALUED)
Still, the narrative can crack if RLI’s higher catastrophe retention amplifies earnings swings, or if a 40.1% expense ratio keeps squeezing underwriting profitability.
Find out about the key risks to this RLI narrative.
Another View: What RLI’s P/E Is Telling You
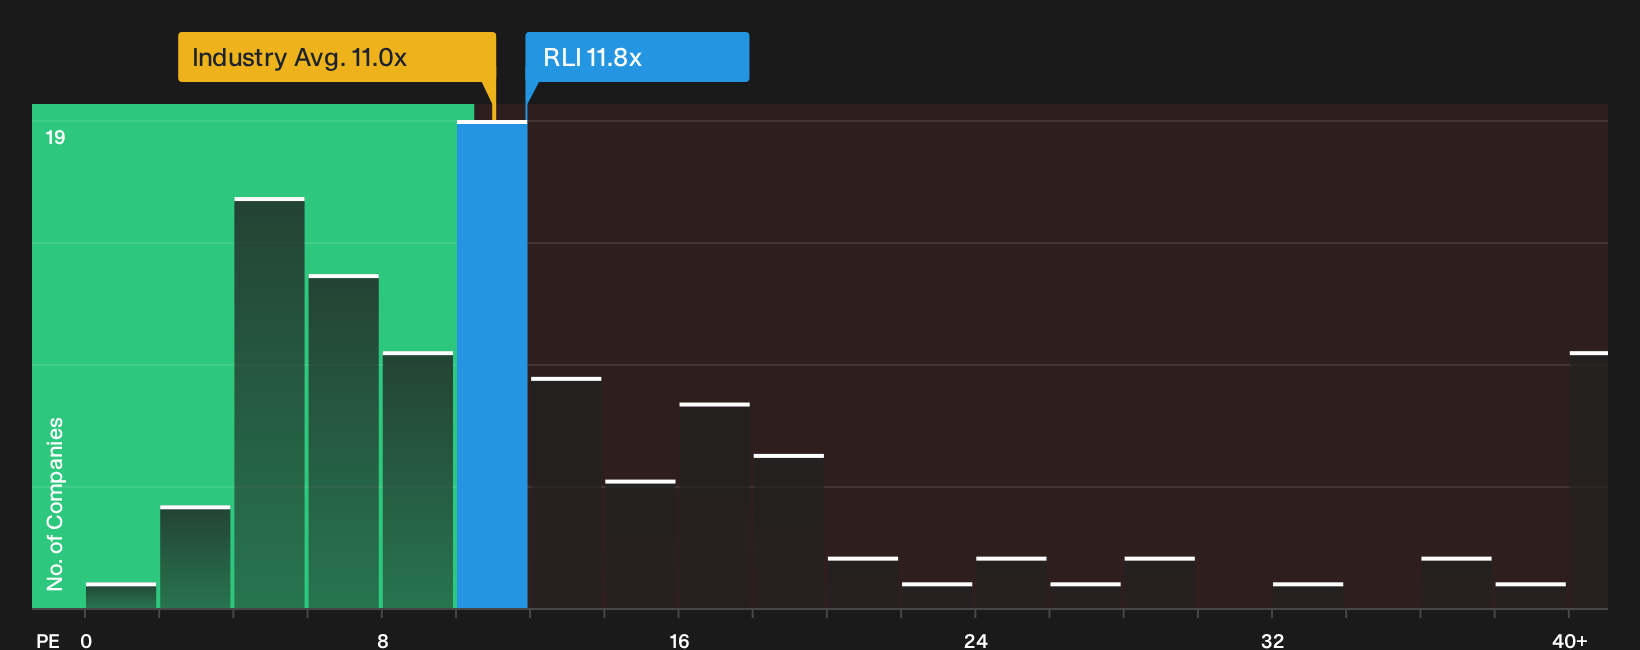
On price tags alone, RLI looks less forgiving. The stock trades on a P/E of 11.8x, compared with a fair ratio of 7.5x, a US Insurance sector average of 10.8x and a peer mark of 7.3x. That richer multiple tightens the margin for error if forecasts prove too optimistic.
To see how the current pricing stacks up against the underlying earnings profile, take a closer look at the valuation breakdown in the See what the numbers say about this price — find out in our valuation breakdown.
Next Steps
Mixed messages in the RLI story so far? If you want a clearer read on the trade off between risk and reward, review the key warnings and potential upsides in the 2 key rewards and 2 important warning signs
Looking for more RLI sized investment ideas?
You have seen how RLI stacks up on valuation and risk. Now push your research further by scanning targeted stock ideas built from clear, rule based screens.
- Target long term value by reviewing companies that currently screen as 29 high quality undervalued stocks with solid fundamentals backing their price tags.
- Strengthen portfolio resilience by focusing on a list of solid balance sheet and fundamentals (25 results) that filters for cleaner debt profiles and healthier financial footing.
- Get ahead of the crowd by hunting through 20 high quality undiscovered gems that pair quality metrics with lower market attention.
This article by Simply Wall St is general in nature. We provide commentary based on historical data and analyst forecasts only using an unbiased methodology and our articles are not intended to be financial advice. It does not constitute a recommendation to buy or sell any stock, and does not take account of your objectives, or your financial situation. We aim to bring you long-term focused analysis driven by fundamental data. Note that our analysis may not factor in the latest price-sensitive company announcements or qualitative material. Simply Wall St has no position in any stocks mentioned.
Have feedback on this article? Concerned about the content? Get in touch with us directly. Alternatively, email editorial-team@simplywallst.com