
Imperial Oil (TSX:IMO) Highlights Kearl Efficiencies, Is The Upside Already Priced In?
Recent coverage of Imperial Oil (TSX:IMO) has zeroed in on efficiency gains at its Kearl operation, where lower unit cash costs are expected to support earnings power and increase sensitivity to crude price swings.
That Kearl efficiency story is landing in a market that already sees momentum in Imperial Oil, with the share price at CA$183.75 after a 4.55% 1 day move and a year to date share price return of 50.23%. The 5 year total shareholder return of 388.63% shows how long term holders have been rewarded, even as recent gains moderate slightly from the shorter term 8.71% 90 day share price return.
See how Imperial Oil compares with other integrated producers that combine operational efficiency with scale by reviewing our curated list of list of solid balance sheet and fundamentals (8 results)
After a 50% year to date surge that leaves Imperial Oil trading above the average analyst target and yet at a discount to one intrinsic value estimate, the question is where fair value really sits now.
Most Popular Narrative: 15.3% Overvalued
Against the last close at CA$183.75, the most followed narrative pegs Imperial Oil’s fair value near CA$159. This frames today’s rally as stretching beyond that estimate while still anchored in detailed cash flow and margin work.
The numbers and this narrative’s view that Imperial Oil is fairly valued imply the share price already reflects both the company’s recent free cash generation and its commitment to return surplus cash through dividends and buybacks.
See why 30 investors see Imperial Oil as 15% overvalued.
Result: Fair Value of CA$159.35 (OVERVALUED)
Still, Imperial Oil’s story could change quickly if decarbonization rules tighten more than expected or if high maintenance spending absorbs more cash than planned.
Find out about the key risks to this Imperial Oil narrative.
Another View: DCF Puts Imperial Oil In A Different Light
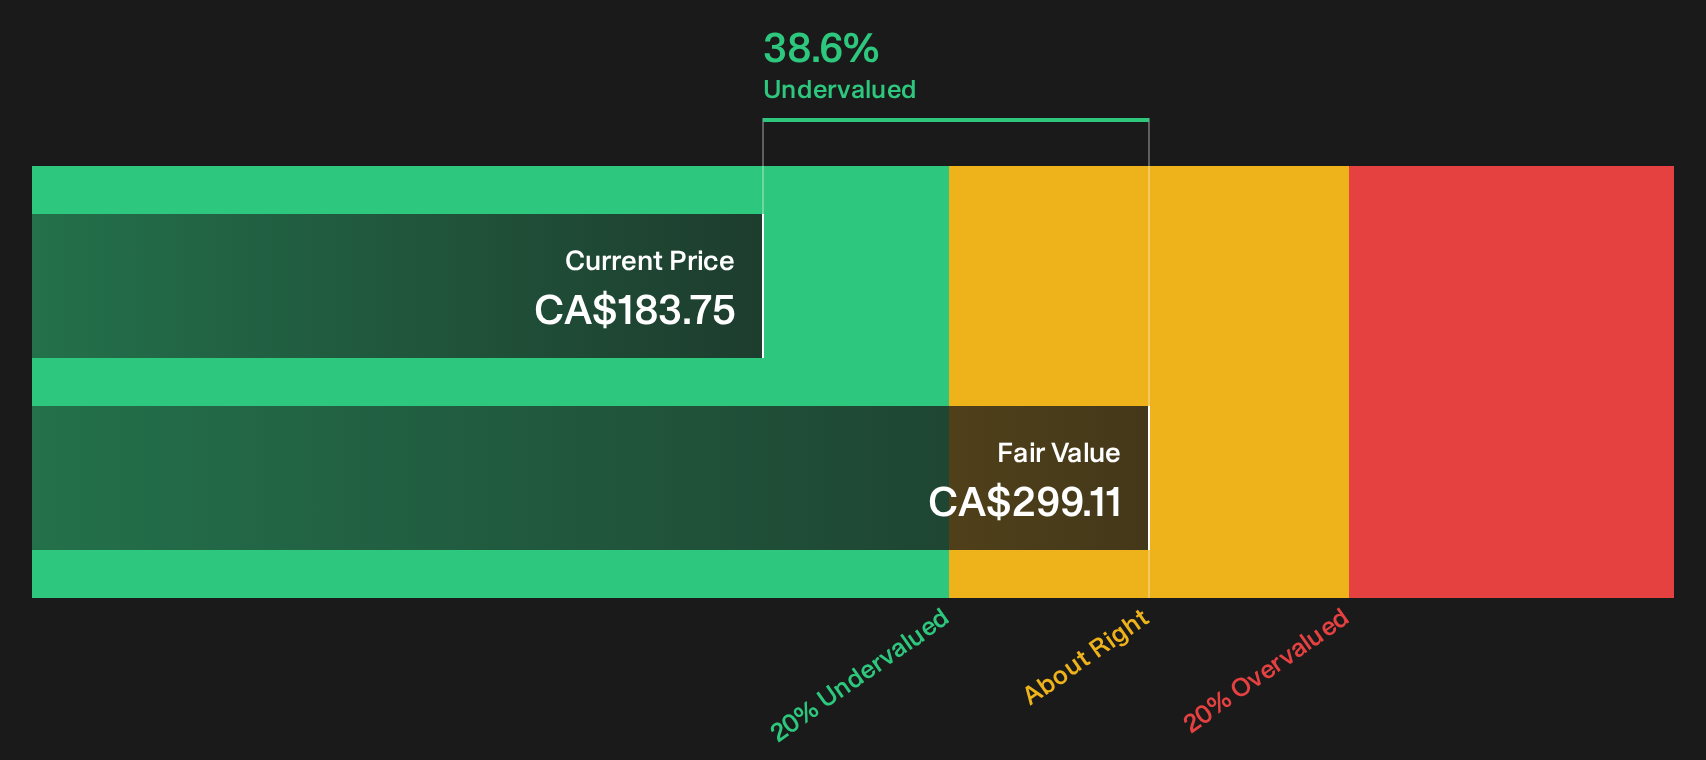
Analyst narratives see Imperial Oil as roughly 15% overvalued around CA$183.75, but the SWS DCF model points in the opposite direction. On that future cash flow view, the shares trade at about a 38.6% discount to an intrinsic value of CA$299.11. Which lens feels more realistic to you?
To understand how much relies on long term cash generation assumptions, and how sensitive the outcome is to those inputs, Look into how the SWS DCF model arrives at its fair value.
Simply Wall St performs a discounted cash flow (DCF) on every stock in the world every day (check out Imperial Oil for example). We show the entire calculation in full. You can track the result in your watchlist or portfolio and be alerted when this changes, or use our stock screener to discover 7 high quality undervalued stocks. If you save a screener we even alert you when new companies match - so you never miss a potential opportunity.
Next Steps
If the mixed messages around Imperial Oil leave you torn, move quickly from reading to running your own checks using the 2 key rewards and 1 important warning sign.
Looking for more Imperial Oil sized investment ideas?
If Imperial Oil has sharpened your focus on valuation and resilience, do not stop here. Broaden your watchlist now so potential opportunities do not pass you by.
- Target strong fundamentals and potential mispricing by scanning a curated spread of companies through the 7 high quality undervalued stocks.
- Prioritise income and stability by reviewing higher yielding opportunities in the 2 dividend fortresses.
- Reduce surprises in your portfolio by focusing on companies with steadier profiles using the 8 resilient stocks with low risk scores.
This article by Simply Wall St is general in nature. We provide commentary based on historical data and analyst forecasts only using an unbiased methodology and our articles are not intended to be financial advice. It does not constitute a recommendation to buy or sell any stock, and does not take account of your objectives, or your financial situation. We aim to bring you long-term focused analysis driven by fundamental data. Note that our analysis may not factor in the latest price-sensitive company announcements or qualitative material. Simply Wall St has no position in any stocks mentioned.
Have feedback on this article? Concerned about the content? Get in touch with us directly. Alternatively, email editorial-team@simplywallst.com