
Asian Market Highlights 3 Value Stocks Priced Below Estimated Worth
The Asian markets have been navigating a complex landscape marked by geopolitical tensions and fluctuating energy prices, which have contributed to volatility in various sectors. Amidst these challenges, investors are increasingly focused on identifying value stocks that are priced below their estimated worth, offering potential opportunities for growth. In this environment, a good stock is typically characterized by strong fundamentals and resilience to market fluctuations.
Top 10 Undervalued Stocks Based On Cash Flows In Asia
| Name | Current Price | Fair Value (Est) | Discount (Est) |
| TOKAI (TSE:9729) | ¥2583.00 | ¥5037.09 | 48.7% |
| Shinhan Financial Group (KOSE:A055550) | ₩99700.00 | ₩195445.15 | 49% |
| Riken Technos (TSE:4220) | ¥2452.00 | ¥4775.86 | 48.7% |
| Nissui (TSE:1332) | ¥1090.00 | ¥2153.87 | 49.4% |
| Monde Nissin (PSE:MONDE) | ₱6.39 | ₱12.68 | 49.6% |
| Marco Polo Marine (SGX:5LY) | SGD0.119 | SGD0.23 | 49% |
| Kumagai GumiLtd (TSE:1861) | ¥1206.00 | ¥2378.84 | 49.3% |
| Inner Mongolia ERDOS ResourcesLtd (SHSE:600295) | CN¥14.14 | CN¥28.12 | 49.7% |
| Astellas Pharma (TSE:4503) | ¥2300.50 | ¥4494.42 | 48.8% |
| Apex Mining (PSE:APX) | ₱16.96 | ₱33.14 | 48.8% |
Here we highlight a subset of our preferred stocks from the screener.
Astellas Pharma (TSE:4503)
Overview: Astellas Pharma Inc. is a global pharmaceutical company involved in the research, development, manufacture, sale, and supply of pharmaceuticals, with a market capitalization of approximately ¥4.12 trillion.
Operations: The company generates revenue primarily from its pharmaceutical segment, which accounted for ¥2.27 trillion.
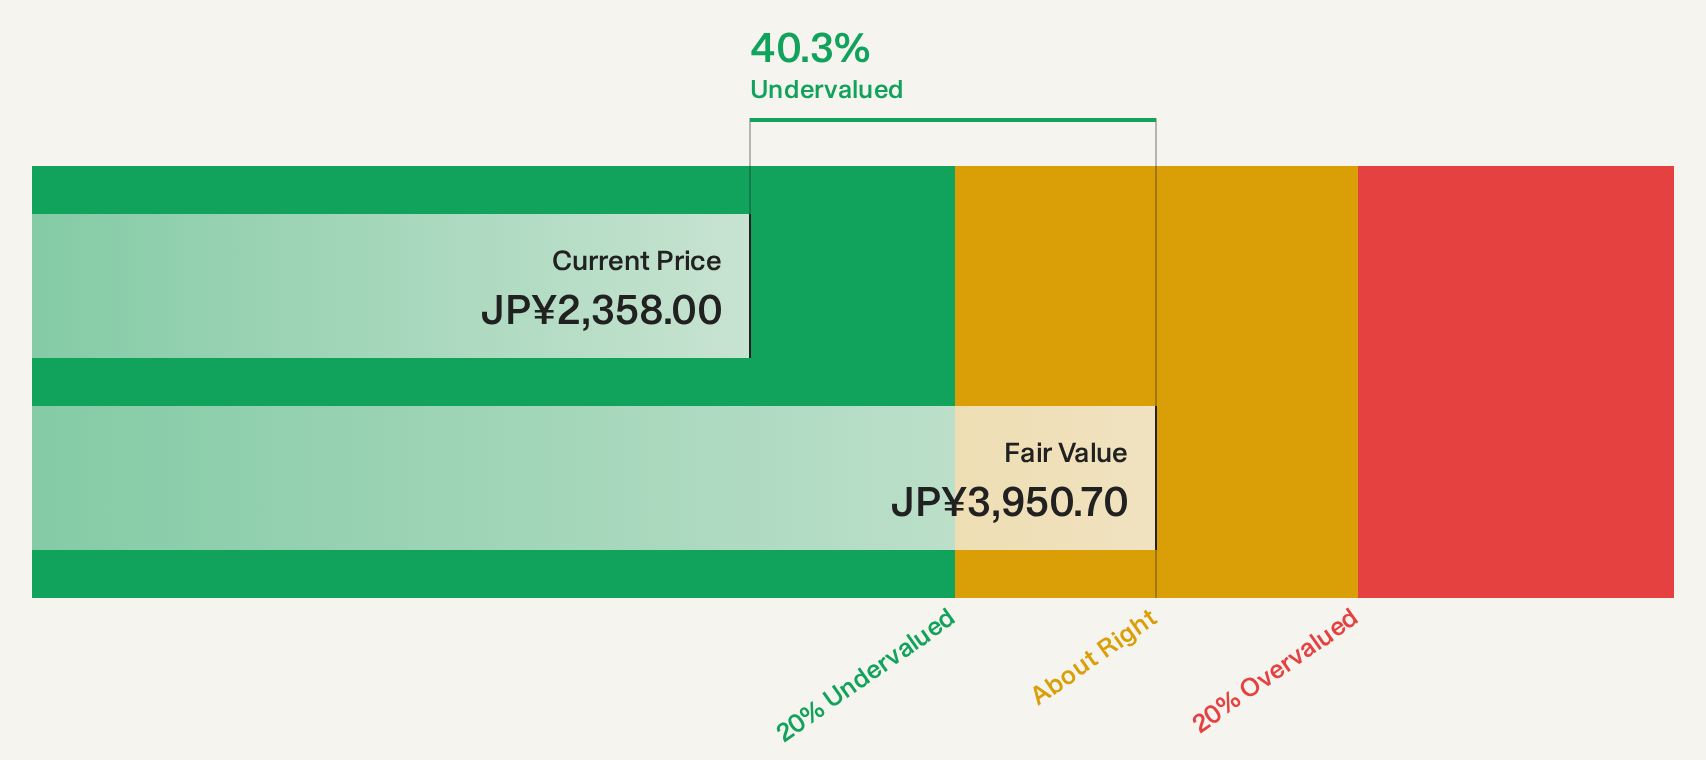
Estimated Discount To Fair Value: 48.8%
Astellas Pharma is trading at ¥2300.5, significantly below its estimated cash flow value of ¥4494.42, indicating it may be undervalued based on cash flows. Despite expected revenue and earnings declines over the next three years, Astellas maintains a reliable 3.48% dividend yield and trades well compared to peers. Recent FDA Fast Track designation for VIR-5500 highlights ongoing innovation efforts, potentially enhancing long-term value despite short-term financial challenges.
- Upon reviewing our latest growth report, Astellas Pharma's projected financial performance appears quite optimistic.
- Dive into the specifics of Astellas Pharma here with our thorough financial health report.
Canon (TSE:7751)
Overview: Canon Inc., along with its subsidiaries, engages in the development, production, sale, and servicing of diverse printing, medical, imaging, and industrial equipment across Japan, the Americas, Europe, Asia, and Oceania with a market cap of ¥4 trillion.
Operations: Canon's revenue is derived from its diverse operations in printing, medical, imaging, and industrial equipment across multiple regions including Japan, the Americas, Europe, Asia, and Oceania.
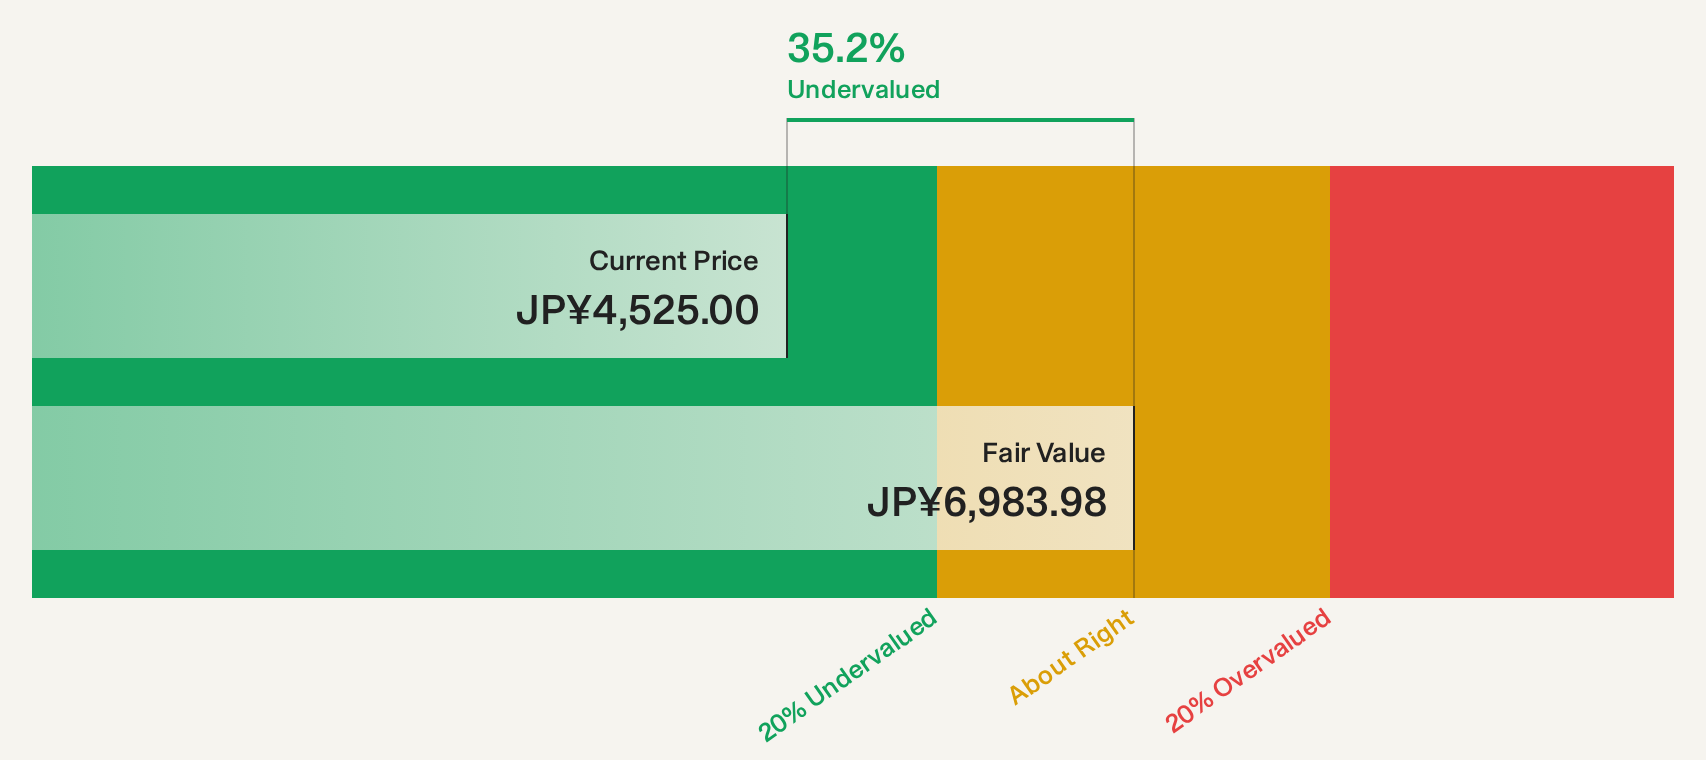
Estimated Discount To Fair Value: 33.7%
Canon is priced at ¥4716, trading substantially below its estimated future cash flow value of ¥7113.72, highlighting potential undervaluation. Despite a slower forecasted earnings growth rate of 2.8% compared to the JP market's 9.6%, Canon shows strong recent performance with a significant earnings increase over the past year and a completed share buyback program worth ¥199.99 billion, enhancing shareholder value amid stable financials and product innovation like the EOS R8 Mark II camera launch.
- The growth report we've compiled suggests that Canon's future prospects could be on the up.
- Unlock comprehensive insights into our analysis of Canon stock in this financial health report.
Ricoh Company (TSE:7752)
Overview: Ricoh Company, Ltd., with a market cap of ¥994.64 billion, operates globally in digital services, digital products, graphic communications, and industrial solutions through its subsidiaries.
Operations: Ricoh's revenue primarily derives from its operations in digital services, digital products, graphic communications, and industrial solutions across various regions including Japan, the Americas, Europe, the Middle East, and Africa.
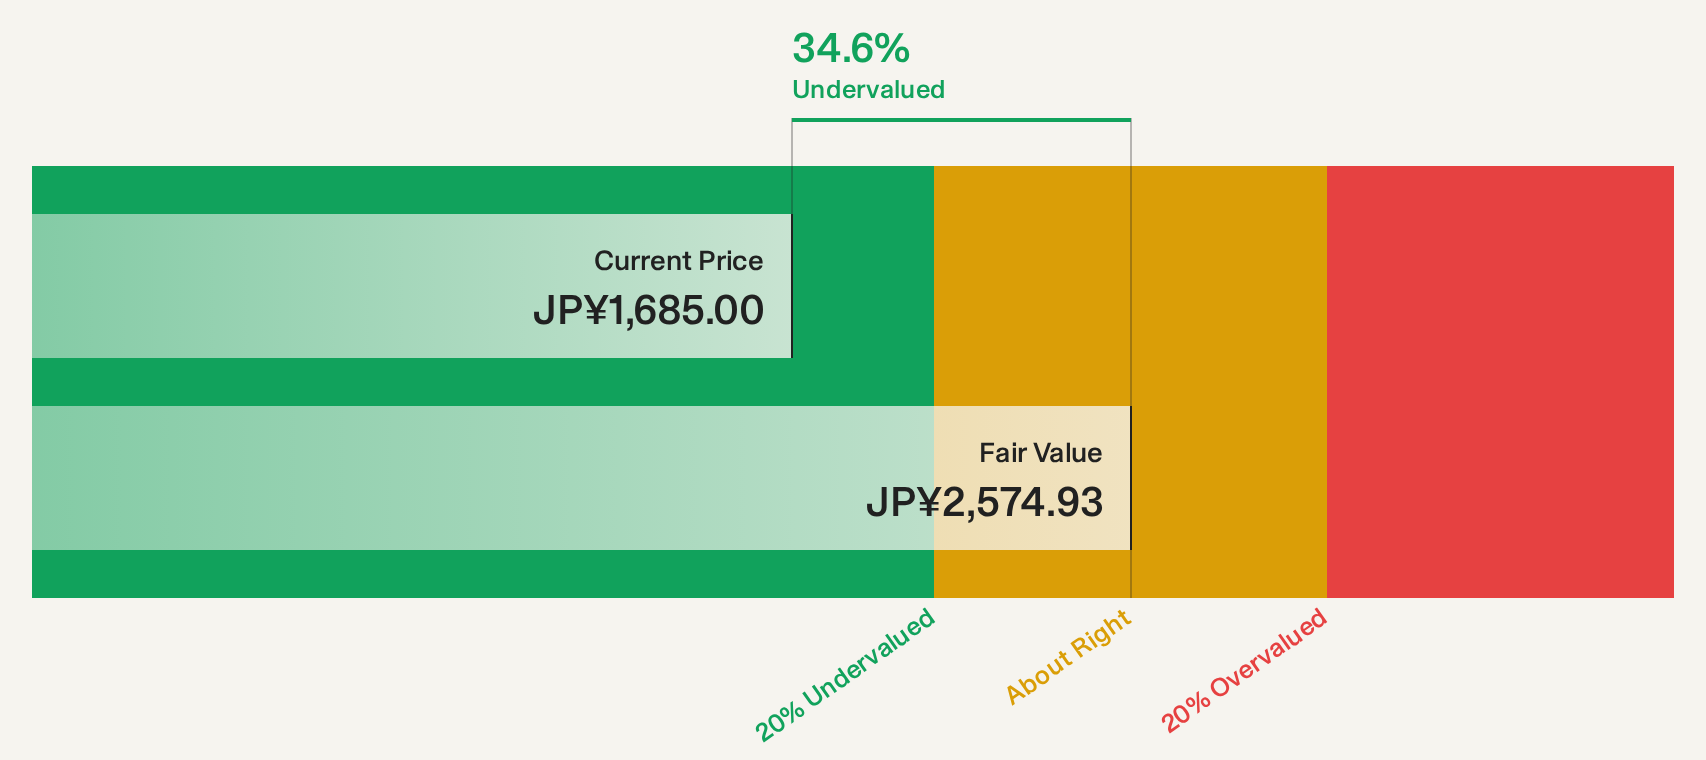
Estimated Discount To Fair Value: 33.3%
Ricoh Company is trading at ¥1,761, significantly below its estimated future cash flow value of ¥2,639.39, suggesting potential undervaluation. Despite a forecasted annual earnings decline of 2% over the next three years and slower revenue growth compared to the JP market, Ricoh's recent earnings surged by 74.7%. The company completed a share buyback worth ¥17.45 billion and increased dividends, reflecting proactive capital management amidst challenging growth forecasts.
- Insights from our recent growth report point to a promising forecast for Ricoh Company's business outlook.
- Navigate through the intricacies of Ricoh Company with our comprehensive financial health report here.
Where To Now?
- Navigate through the entire inventory of 173 Undervalued Asian Stocks Based On Cash Flows here.
- Shareholder in one or more of these companies? Ensure you're never caught off-guard by adding your portfolio in Simply Wall St for timely alerts on significant stock developments.
- Invest smarter with the free Simply Wall St app providing detailed insights into every stock market around the globe.
Contemplating Other Strategies?
- Explore high-performing small cap companies that haven't yet garnered significant analyst attention.
- Diversify your portfolio with solid dividend payers offering reliable income streams to weather potential market turbulence.
- Fuel your portfolio with companies showing strong growth potential, backed by optimistic outlooks both from analysts and management.
This article by Simply Wall St is general in nature. We provide commentary based on historical data and analyst forecasts only using an unbiased methodology and our articles are not intended to be financial advice. It does not constitute a recommendation to buy or sell any stock, and does not take account of your objectives, or your financial situation. We aim to bring you long-term focused analysis driven by fundamental data. Note that our analysis may not factor in the latest price-sensitive company announcements or qualitative material. Simply Wall St has no position in any stocks mentioned.
Have feedback on this article? Concerned about the content? Get in touch with us directly. Alternatively, email editorial-team@simplywallst.com