
Global Market Insights: 3 Stocks Possibly Trading Below Estimated Value
Global markets have recently experienced volatility, influenced by factors such as fluctuating oil prices due to Middle East tensions and mixed performances across major indices like the S&P 500 and Nasdaq Composite. Amid this uncertainty, identifying stocks that may be trading below their estimated value can present opportunities for investors seeking to capitalize on potential market inefficiencies.
Top 10 Undervalued Stocks Based On Cash Flows
| Name | Current Price | Fair Value (Est) | Discount (Est) |
| Valmet Oyj (HLSE:VALMT) | €26.66 | €53.04 | 49.7% |
| PORR (WBAG:POS) | €30.65 | €60.56 | 49.4% |
| Nissui (TSE:1332) | ¥1081.00 | ¥2146.38 | 49.6% |
| Monde Nissin (PSE:MONDE) | ₱6.35 | ₱12.68 | 49.9% |
| Lindab International (OM:LIAB) | SEK126.30 | SEK250.80 | 49.6% |
| Koninklijke BAM Groep (ENXTAM:BAMNB) | €11.53 | €22.82 | 49.5% |
| ING Groep (ENXTAM:INGA) | €30.10 | €59.67 | 49.6% |
| Astellas Pharma (TSE:4503) | ¥2260.50 | ¥4494.42 | 49.7% |
| Apator (WSE:APT) | PLN24.80 | PLN49.38 | 49.8% |
| ALEC Holdings PJSC (DFM:ALEC) | AED1.275 | AED2.54 | 49.7% |
Let's take a closer look at a couple of our picks from the screened companies.
Emaar Development PJSC (DFM:EMAARDEV)
Overview: Emaar Development PJSC, along with its subsidiaries, focuses on developing and selling residential and commercial properties in the United Arab Emirates, with a market capitalization of AED51.20 billion.
Operations: The company generates revenue of AED30.89 billion from its real estate development business, which involves creating and marketing residential and commercial properties in the UAE.
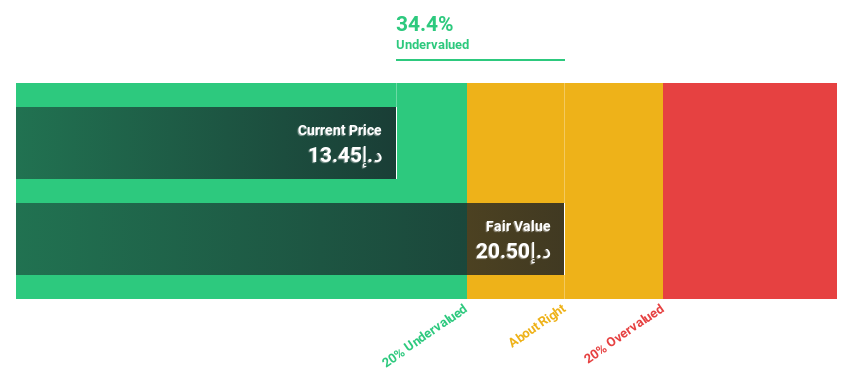
Estimated Discount To Fair Value: 31.6%
Emaar Development PJSC is trading at 31.6% below its estimated fair value and more than 20% below its future cash flow value, suggesting potential undervaluation. Recent earnings showed significant growth, with a net income increase to AED 2.64 billion in Q2 2026 from AED 1.84 billion a year ago. Despite an unstable dividend history, the company's revenue and earnings are forecasted to grow annually by over 10% and faster than the AE market respectively.
- According our earnings growth report, there's an indication that Emaar Development PJSC might be ready to expand.
- Take a closer look at Emaar Development PJSC's balance sheet health here in our report.
Fuchun Dye and Weave Group (SHSE:605189)
Overview: Fuchun Dye and Weave Group Co., Ltd. focuses on the research, development, production, and sale of colored yarns primarily in China, with a market cap of CN¥3.48 billion.
Operations: The company generates revenue of CN¥4.10 billion from its research and development, production, and sales of dyed yarns.
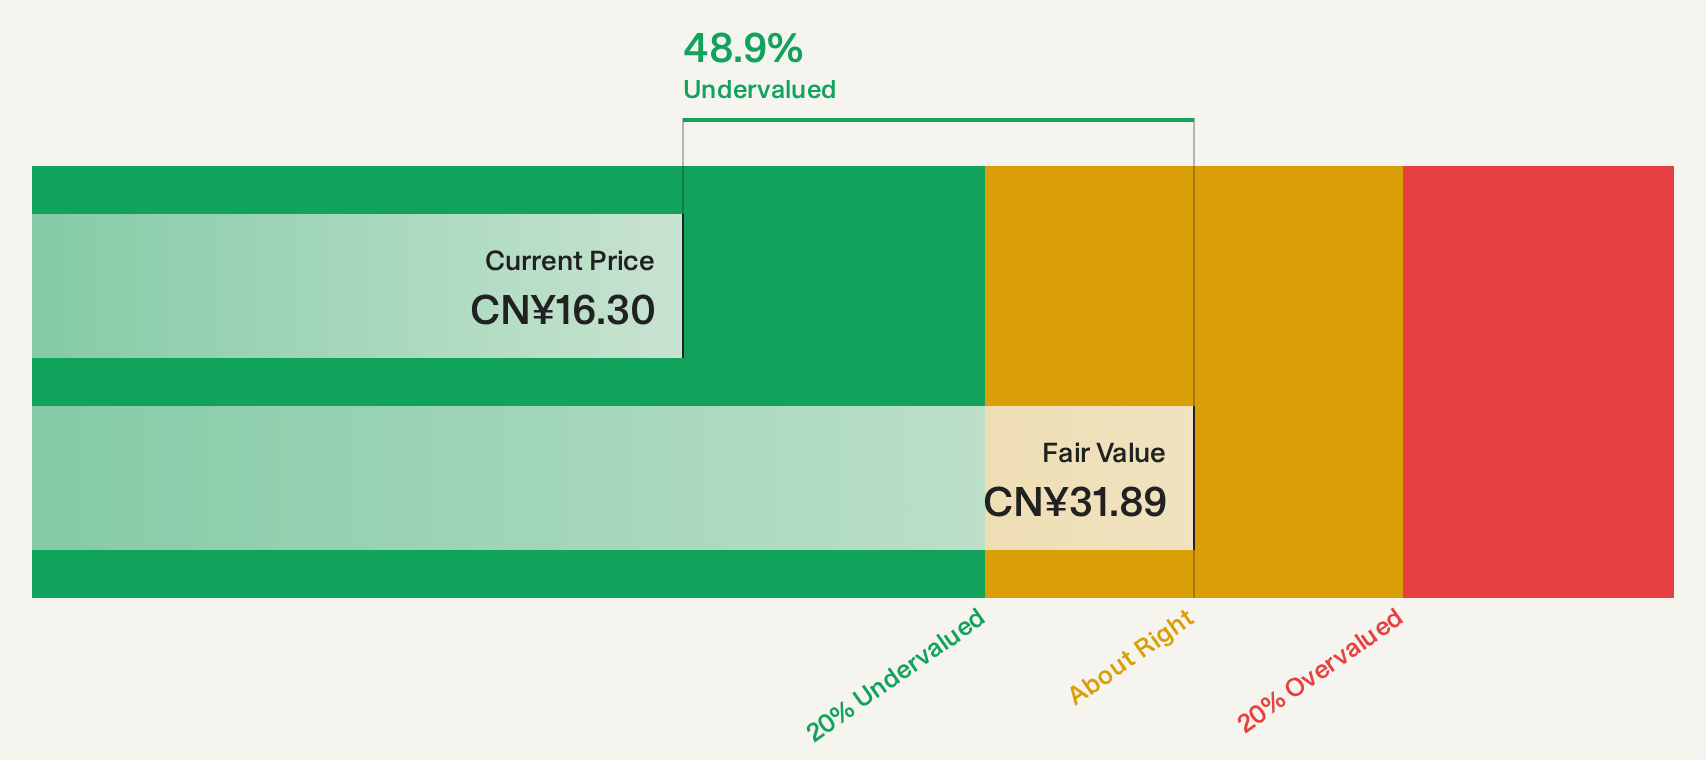
Estimated Discount To Fair Value: 46.8%
Fuchun Dye and Weave Group is trading at CN¥16.23, significantly below its estimated future cash flow value of CN¥30.53, indicating potential undervaluation. Despite a high debt level and an unstable dividend track record, recent earnings showed robust growth with net income rising to CN¥179.79 million for H1 2026 from CN¥13.44 million a year ago. However, revenue growth is expected to lag behind the broader Chinese market in the coming years.
- Our growth report here indicates Fuchun Dye and Weave Group may be poised for an improving outlook.
- Unlock comprehensive insights into our analysis of Fuchun Dye and Weave Group stock in this financial health report.
Tung Ho Steel Enterprise (TWSE:2006)
Overview: Tung Ho Steel Enterprise Corporation, with a market cap of NT$64.40 billion, produces and sells steel products in Taiwan through its subsidiaries.
Operations: The company's revenue primarily comes from its Steel Department, generating NT$48.60 billion, followed by the Steel Structure Department with NT$15.57 billion.
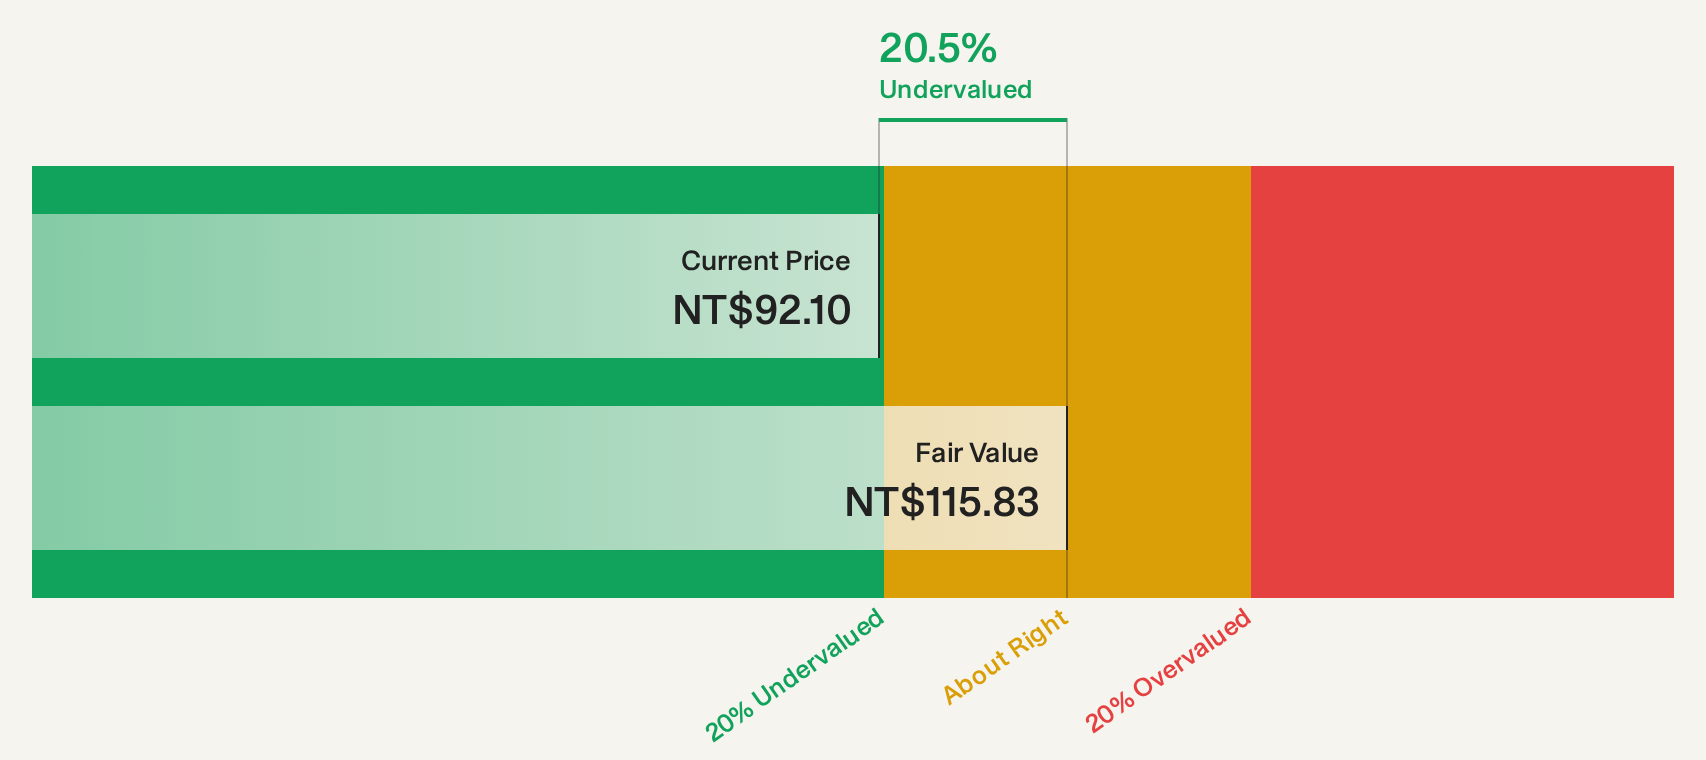
Estimated Discount To Fair Value: 22.5%
Tung Ho Steel Enterprise is trading at NT$89.4, below its estimated future cash flow value of NT$115.39, highlighting potential undervaluation. Recent earnings showed improvement with Q2 net income rising to TWD 1,759.89 million from TWD 1,104.42 million a year prior. Despite this growth, the company's earnings are forecasted to decline by an average of 5.6% annually over the next three years and revenue growth is expected to lag behind the Taiwanese market significantly.
- The growth report we've compiled suggests that Tung Ho Steel Enterprise's future prospects could be on the up.
- Click to explore a detailed breakdown of our findings in Tung Ho Steel Enterprise's balance sheet health report.
Seize The Opportunity
- Navigate through the entire inventory of 252 Undervalued Global Stocks Based On Cash Flows here.
- Shareholder in one or more of these companies? Ensure you're never caught off-guard by adding your portfolio in Simply Wall St for timely alerts on significant stock developments.
- Elevate your portfolio with Simply Wall St, the ultimate app for investors seeking global market coverage.
Curious About Other Options?
- Explore high-performing small cap companies that haven't yet garnered significant analyst attention.
- Diversify your portfolio with solid dividend payers offering reliable income streams to weather potential market turbulence.
- Fuel your portfolio with companies showing strong growth potential, backed by optimistic outlooks both from analysts and management.
This article by Simply Wall St is general in nature. We provide commentary based on historical data and analyst forecasts only using an unbiased methodology and our articles are not intended to be financial advice. It does not constitute a recommendation to buy or sell any stock, and does not take account of your objectives, or your financial situation. We aim to bring you long-term focused analysis driven by fundamental data. Note that our analysis may not factor in the latest price-sensitive company announcements or qualitative material. Simply Wall St has no position in any stocks mentioned.
Have feedback on this article? Concerned about the content? Get in touch with us directly. Alternatively, email editorial-team@simplywallst.com