
Is MDU Resources Group (MDU) Undervalued Following Its Recent Pullback?
MDU Resources Group (MDU) is back in focus after recent trading left the stock down over the past month and the past 3 months, prompting investors to reassess this regulated utility’s risk and return profile.
Recent trading has chipped away at momentum, with the 90-day share price return down 11.62% and the year-to-date move weaker at 6.19% in the red. Even so, MDU Resources Group still carries a 1-year total shareholder return of 0.20% and a 3-year total shareholder return above 80%.
Compare MDU Resources Group's recent pullback with hand picked utilities and infrastructure peers by scanning the 43 power grid technology and infrastructure stocks that are already positioned around critical energy delivery themes.
After a 90 day slide and a modest long term gain still on the scoreboard, the real tension around MDU Resources Group now sits in the price tag. Does the current valuation still reward fresh risk?
Most Popular Narrative: 21% Undervalued
Against MDU Resources Group’s last close at $18.64, the most followed narrative pegs fair value at $23.63, which points to a sizeable valuation gap that investors now weigh against execution and funding risk on its growth program.
A more growth focused financial posture that combines nearly US$800m of 2025 capital expenditure, a US$3.1b 2026 to 2030 capital plan, substantial equity issuance completed in late 2025 and a lower long term dividend payout target of 55% to 65% provides funding capacity for MDU Resources Group to build out its project pipeline, which can translate into higher future revenue, cash flow and earnings if projects perform as planned.
See why 4 investors see MDU Resources Group as 21% undervalued.
Result: Fair Value of $23.63 (UNDERVALUED)
Still, the whole story around MDU Resources Group could change quickly if carbon rules cut long term gas demand, or if further equity funding dilutes future per share returns.
Find out about the key risks to this MDU Resources Group narrative.
Another View: What MDU Resources Group’s P/E Is Telling You
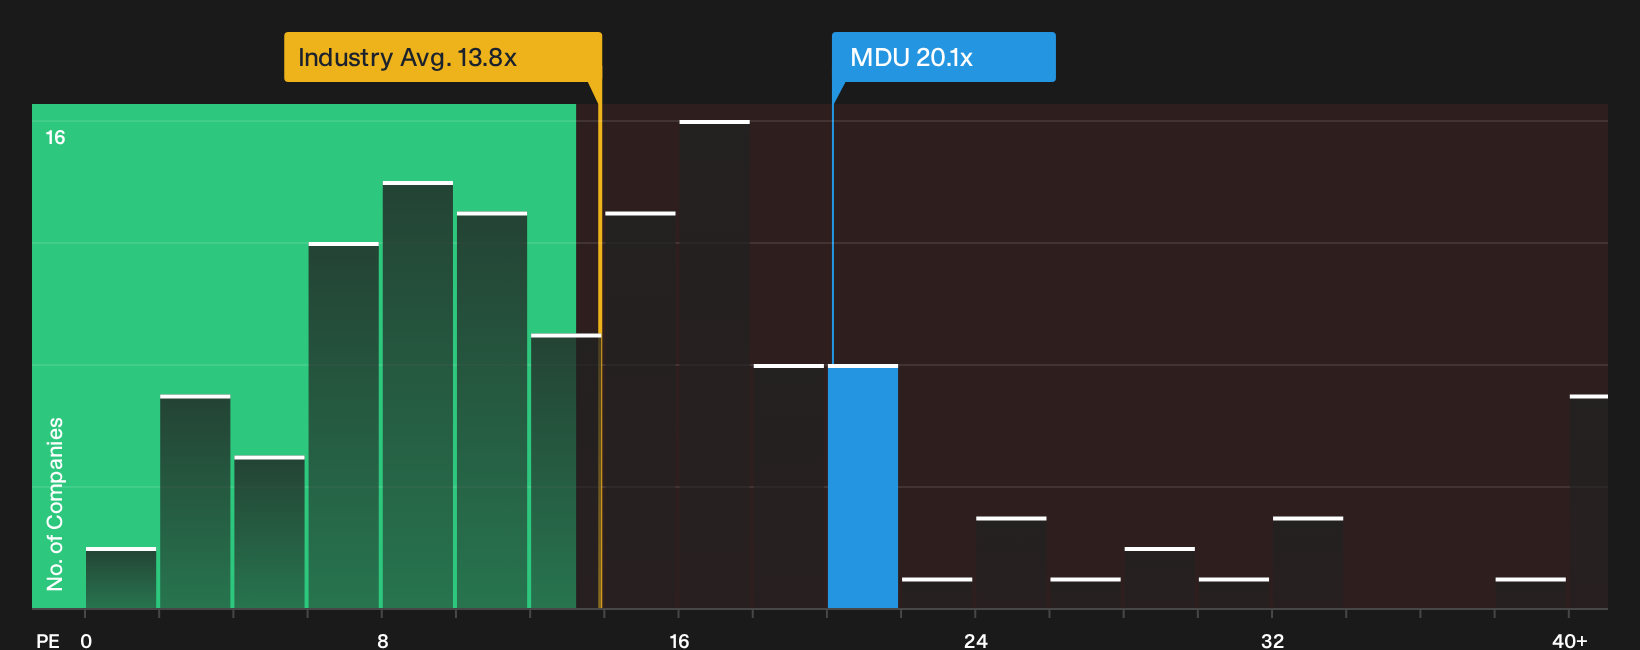
The first narrative paints MDU Resources Group as undervalued on fair value estimates, yet the P/E ratio tells a tougher story. At 20.1x earnings, the stock trades above the peer average of 17.5x and above its own fair ratio of 19.6x. This points to limited margin for error if growth or returns disappoint.
For investors weighing these mixed signals, the richer P/E against both peers and the fair ratio raises a practical question: Is the small fair value gap enough to offset the risk that sentiment moves the multiple closer to industry levels if enthusiasm cools?
See what the numbers say about this price — find out in our valuation breakdown.
Next Steps
Mixed signals like these often split opinion, so treat this as a prompt to review the underlying data, pressure test your thesis, and move decisively once you have weighed the 3 key rewards and 2 important warning signs.
Looking for more investment ideas beyond MDU Resources Group?
If MDU Resources Group is on your radar, do not stop there. The broader opportunity set is where your next strong idea often hides quietly.
- Target potential mispricing by scanning companies that currently screen as 32 high quality undervalued stocks with solid fundamentals backing their valuations.
- Prioritize resilience by focusing on businesses from the 32 resilient stocks with low risk scores that score well on balance sheet strength and earnings stability.
- Get ahead of the crowd by reviewing the 20 high quality undiscovered gems that combine quality metrics with limited existing market attention.
This article by Simply Wall St is general in nature. We provide commentary based on historical data and analyst forecasts only using an unbiased methodology and our articles are not intended to be financial advice. It does not constitute a recommendation to buy or sell any stock, and does not take account of your objectives, or your financial situation. We aim to bring you long-term focused analysis driven by fundamental data. Note that our analysis may not factor in the latest price-sensitive company announcements or qualitative material. Simply Wall St has no position in any stocks mentioned.
Have feedback on this article? Concerned about the content? Get in touch with us directly. Alternatively, email editorial-team@simplywallst.com