
Is Konica Minolta (TSE:4902) Still Undervalued As It Launches SpectraMagic CMS?
Konica Minolta’s SpectraMagic CMS launch and why it matters for the stock
Konica Minolta (TSE:4902) has rolled out SpectraMagic CMS, a colour matching software aimed at manufacturers that want more precise formulation, less material waste, and tighter process control across colour critical production.
Recent trading tells a mixed story. The 30 day share price return of 6.88% and 90 day gain of 5.57%, including a 3.29% move over the past week, point to building momentum. However, the year to date share price return is still down 4.45%, and over the longer term, total shareholder returns of 28.18% over one year and 51.09% over three years indicate that investors who stayed with Konica Minolta have already seen a meaningful payoff.
Capitalize on Konica Minolta’s SpectraMagic CMS momentum by scanning a curated 90 robotics and automation stocks that are also sharpening industrial efficiency through automation and precision technology.Konica Minolta’s share price has climbed in recent weeks while sitting only a fraction below the average analyst target and far below some intrinsic value estimates. How much of that gap still looks interesting on valuation alone?
Price-to-earnings of 10x for Konica Minolta: Is it justified?
On simple valuation terms, Konica Minolta looks cheap. The shares last closed at ¥659.9, while the stock trades on a P/E of 10x, which is presented as good value relative to both peers and intrinsic value checks.
The P/E ratio compares what investors pay today for each unit of current earnings. For a mature tech-related business that has just moved back into profitability and carries forecast earnings growth of 1.28% per year, that kind of multiple can indicate fairly modest expectations reflected in the price.
Konica Minolta trades at a P/E of 10x compared with an estimated fair P/E of 15.4x. That is a wide gap and suggests the current market pricing is materially lower than where valuation models indicate it could be. The stock is also described as good value versus the JP Tech industry average P/E of 12.2x and a peer average of 17x, which points to investors applying a meaningful discount to its earnings despite the description of high quality profits and a recent shift back into the black.
Explore the SWS fair ratio for Konica Minolta.
Result: Price-to-earnings of 10x (UNDERVALUED)
Still, the valuation gap only holds if Konica Minolta can keep earnings on track and avoid setbacks in core units such as Digital Workplace or Professional Print.
Find out about the key risks to this Konica Minolta narrative.
Another view on Konica Minolta’s value
A second lens on Konica Minolta uses the SWS DCF model, which values the future cash flows at ¥1,177.51 per share versus the current ¥659.9 price. That suggests the stock is trading at a substantial discount. The key question is whether those long term cash flow assumptions prove realistic or too generous.
Look into how the SWS DCF model arrives at its fair value.
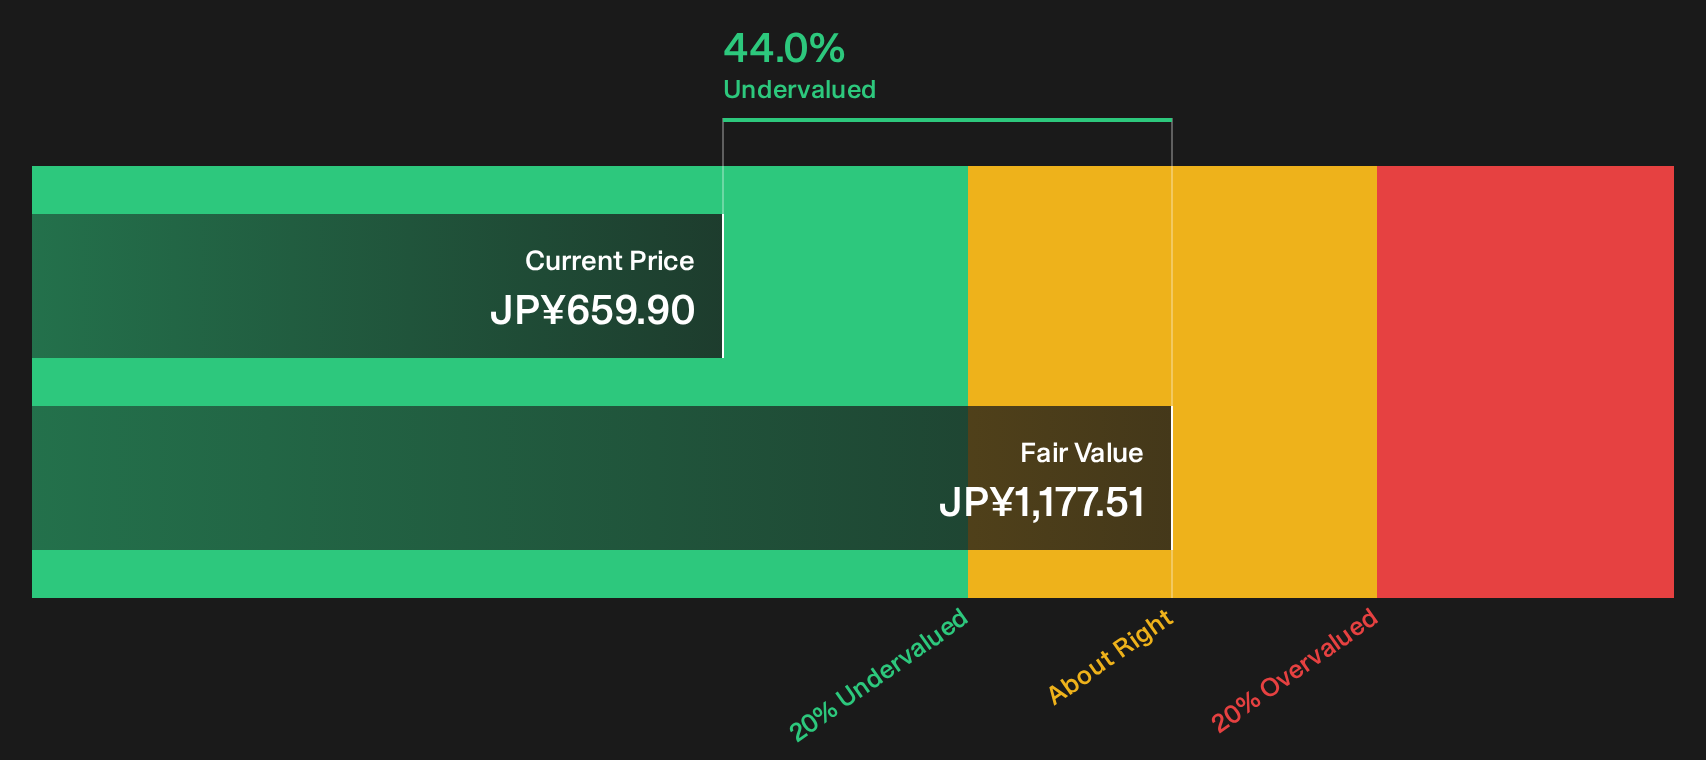
Simply Wall St performs a discounted cash flow (DCF) on every stock in the world every day (check out Konica Minolta for example). We show the entire calculation in full. You can track the result in your watchlist or portfolio and be alerted when this changes, or use our stock screener to discover 14 high quality undervalued stocks. If you save a screener we even alert you when new companies match - so you never miss a potential opportunity.
Next Steps
Mixed signals on Konica Minolta so far. If you want to move quickly and build your own thesis from the ground up, weigh the 4 key rewards and 2 important warning signs.
Looking for more investment ideas beyond Konica Minolta?
If Konica Minolta has your attention today, do not stop there. Use a focused stock search to pressure test your next move and widen your opportunity set.
- Target potential mispricings by running a screen on companies that currently look cheap on quality and valuation using the 14 high quality undervalued stocks.
- Zero in on resilience by scanning a 22 resilient stocks with low risk scores that may handle stress better than the broader market.
- Chase early stage potential by checking a 73 high quality undiscovered gems before the crowd starts paying closer attention.
This article by Simply Wall St is general in nature. We provide commentary based on historical data and analyst forecasts only using an unbiased methodology and our articles are not intended to be financial advice. It does not constitute a recommendation to buy or sell any stock, and does not take account of your objectives, or your financial situation. We aim to bring you long-term focused analysis driven by fundamental data. Note that our analysis may not factor in the latest price-sensitive company announcements or qualitative material. Simply Wall St has no position in any stocks mentioned.
Have feedback on this article? Concerned about the content? Get in touch with us directly. Alternatively, email editorial-team@simplywallst.com