
Is Kewpie (TSE:2809) A Bargain Following Weaker Earnings?
Earnings trigger puts Kewpie in focus
Kewpie (TSE:2809) is back on investors’ radar after nine month results showed sales of ¥397,119 million, alongside lower net income of ¥21,311 million and reduced basic earnings per share.
The latest earnings update and recently completed share buyback sit against a share price of ¥4,274, with the stock slipping 6.48% on a 1 month share price return and 5.55% on a 3 month share price return. At the same time, the 3 year total shareholder return of 77.22% and 5 year total shareholder return of 84.99% point to a stronger longer term journey that investors are now reassessing as momentum cools.
Scan how Kewpie compares to other consumer stocks that have also been under pressure recently by reviewing our curated list of 14 high quality undervalued stocks.
Kewpie now trades at a double discount to both analyst targets and intrinsic estimates after this pullback. Is that caution rooted in the weaker earnings trend, or has the reset gone too far on valuation?
Price-to-earnings of 22.4x: Is it justified?
Kewpie now trades on a P/E of 22.4x, while the share price sits at ¥4,274 and recent returns have cooled against both the market and the food sector.
The P/E ratio compares what investors pay today for each unit of current earnings. For a mature food manufacturer with a broad product mix, that number often reflects expectations around steady profit delivery rather than rapid expansion.
For Kewpie, several signals pull in different directions. Earnings are described as high quality and have grown 13.9% per year over the past 5 years, yet the most recent year showed declining profit and lower net margins of 4.9% compared with 5.5% last year. Forecasts also point to revenue growth of 3.6% per year and earnings growth of 7.5% per year, which are slower than the wider JP market and below thresholds that would usually justify a richer valuation multiple on growth alone. At the same time, the stock is flagged as trading at 33.6% below an internal fair value estimate based on future cash flows. This suggests the current P/E level could move closer to a lower fair P/E of 20.5x if pricing and earnings expectations converge.
Relative comparisons are even starker. The 22.4x P/E is higher than both the peer average of 17.6x and the JP Food industry average of 16.4x, so investors are paying a clear premium multiple against sector benchmarks despite more modest growth expectations and recent underperformance versus the market and industry over 1 year.
Explore the SWS fair ratio for Kewpie.
Result: Price-to-earnings of 22.4x (OVERVALUED)
Still, Kewpie faces clear pressure points, including cooling 1 year returns that are near flat and a value score of 2 that hints at limited cushion if sentiment weakens.
Find out about the key risks to this Kewpie narrative.
Another view on Kewpie’s value
The P/E makes Kewpie look expensive, yet our DCF model tells a different story. On that cash flow view, the shares at ¥4,274 trade 33.6% below an internal estimate of intrinsic value of ¥6,438.89. One model points to risk, while the other suggests a possible gap. Which do you weigh more heavily?
Look into how the SWS DCF model arrives at its fair value.
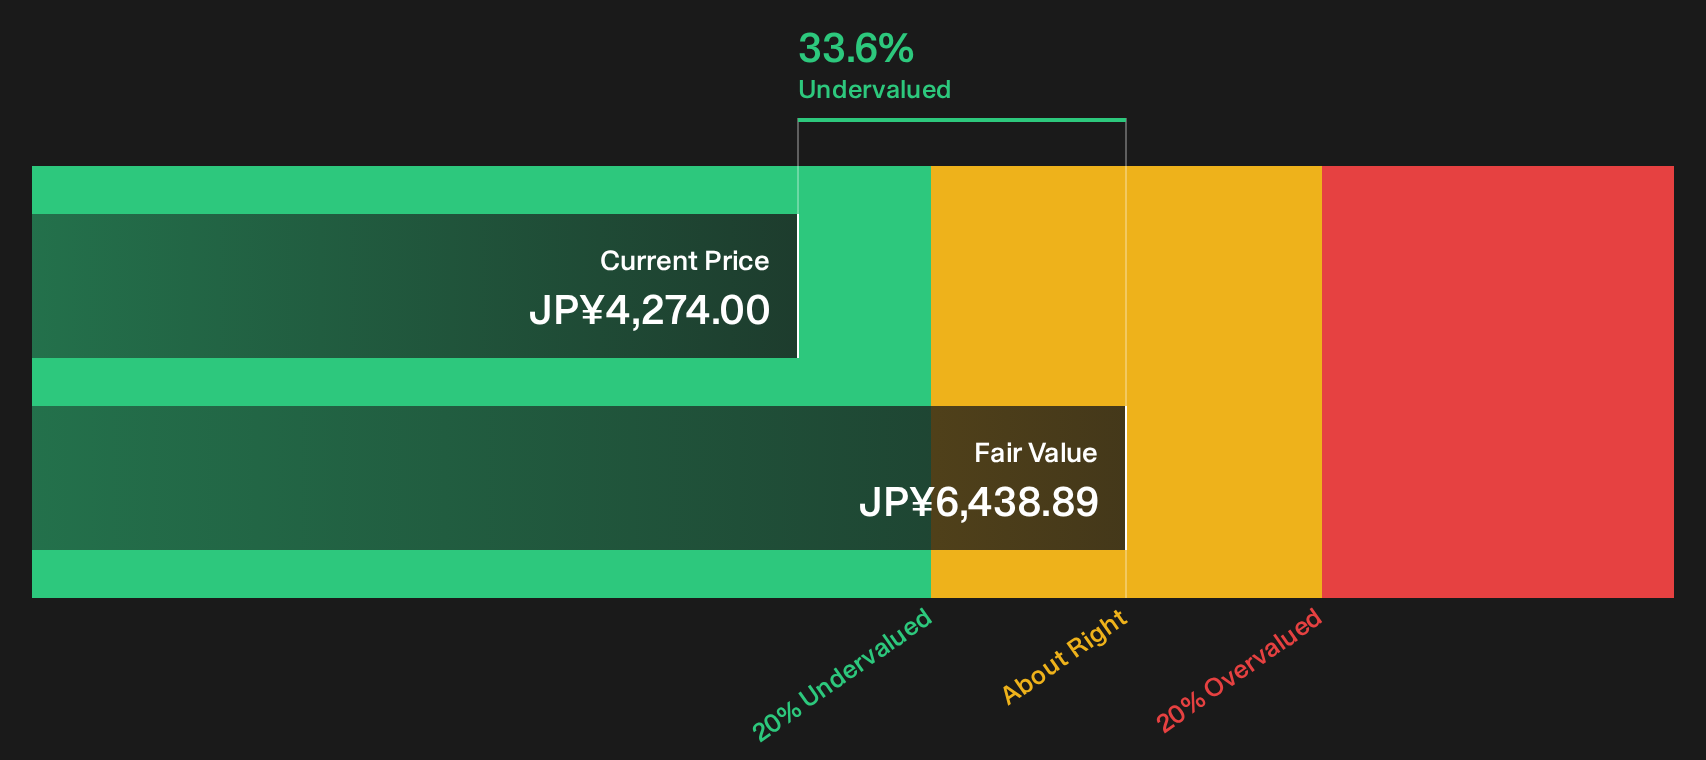
Simply Wall St performs a discounted cash flow (DCF) on every stock in the world every day (check out Kewpie for example). We show the entire calculation in full. You can track the result in your watchlist or portfolio and be alerted when this changes, or use our stock screener to discover 14 high quality undervalued stocks. If you save a screener we even alert you when new companies match - so you never miss a potential opportunity.
Next Steps
Sentiment in this review has been cautious, so move quickly to test the numbers yourself and decide whether Kewpie fits your approach. To see which qualities investors are already optimistic about, take a closer look at the 2 key rewards.
Looking for more investment ideas beyond Kewpie?
If Kewpie looks interesting, do not stop there. Cast the net wider so you are not relying on a single story when plenty of other opportunities exist.
Use these targeted stock lists on Simply Wall St to pressure test your thinking and uncover candidates that might fit your style before others notice.
- Hunt for potential turnarounds by scanning a focused pool of smaller companies with stronger financial filters using the 1 elite penny stocks with strong financials.
- Strengthen your core holdings by reviewing a curated mix of resilient businesses and a list of solid balance sheet and fundamentals (21 results) so you are not exposed to weak finances.
- Get ahead of the crowd by checking a 73 high quality undiscovered gems that highlights quality fundamentals before they hit the mainstream radar.
This article by Simply Wall St is general in nature. We provide commentary based on historical data and analyst forecasts only using an unbiased methodology and our articles are not intended to be financial advice. It does not constitute a recommendation to buy or sell any stock, and does not take account of your objectives, or your financial situation. We aim to bring you long-term focused analysis driven by fundamental data. Note that our analysis may not factor in the latest price-sensitive company announcements or qualitative material. Simply Wall St has no position in any stocks mentioned.
Have feedback on this article? Concerned about the content? Get in touch with us directly. Alternatively, email editorial-team@simplywallst.com