
Is Tradeweb Markets (TW) Undervalued After Strong Trading Volume Growth?
Tradeweb Markets (TW) is back in focus after reporting operating results for September and the third quarter, highlighted by total trading volume of $81.6 trillion for the month and $210.3 trillion for the quarter.
The fresh volume figures arrive as Tradeweb Markets trades at US$110.68, with a 30-day share price return of 6.22% and a 90-day move of 9.38% suggesting momentum has been picking up, while the 5-year total shareholder return of 34.74% points to a steadier long-run trajectory.
Spot similar volume-driven setups to Tradeweb Markets by scanning our curated 20 high quality undiscovered gems with robust fundamentals that are not yet front and center for most investors.Tradeweb Markets now has strong volume trends and steady longer term returns on the board, yet the recent share price move raises a sharper question: Are investors paying a fair price for that quality today?
Most Popular Narrative: 10% Undervalued
Tradeweb Markets closed at $110.68, while the most followed narrative pins fair value closer to $123.64. This raises the key question of whether the growth and profitability profile can support that higher figure under a 7.85% discount rate.
Ongoing migration of fixed income and derivatives trading from manual and voice channels to electronic platforms, supported by growth in institutional U.S. Treasuries, global swaps and U.S. credit protocols such as RFQ, portfolio trading and all-to-all, can support higher transaction volumes and fee revenue for Tradeweb Markets.
See why 12 investors see Tradeweb Markets as 10% undervalued.
Result: Fair Value of $123.64 (UNDERVALUED)
Still, the Tradeweb Markets story can break if revenue keeps missing expectations or if rising technology and communication spend weighs on earnings more than investors currently assume.
Find out about the key risks to this Tradeweb Markets narrative.
Another View: Multiples Paint A Tougher Picture For Tradeweb Markets
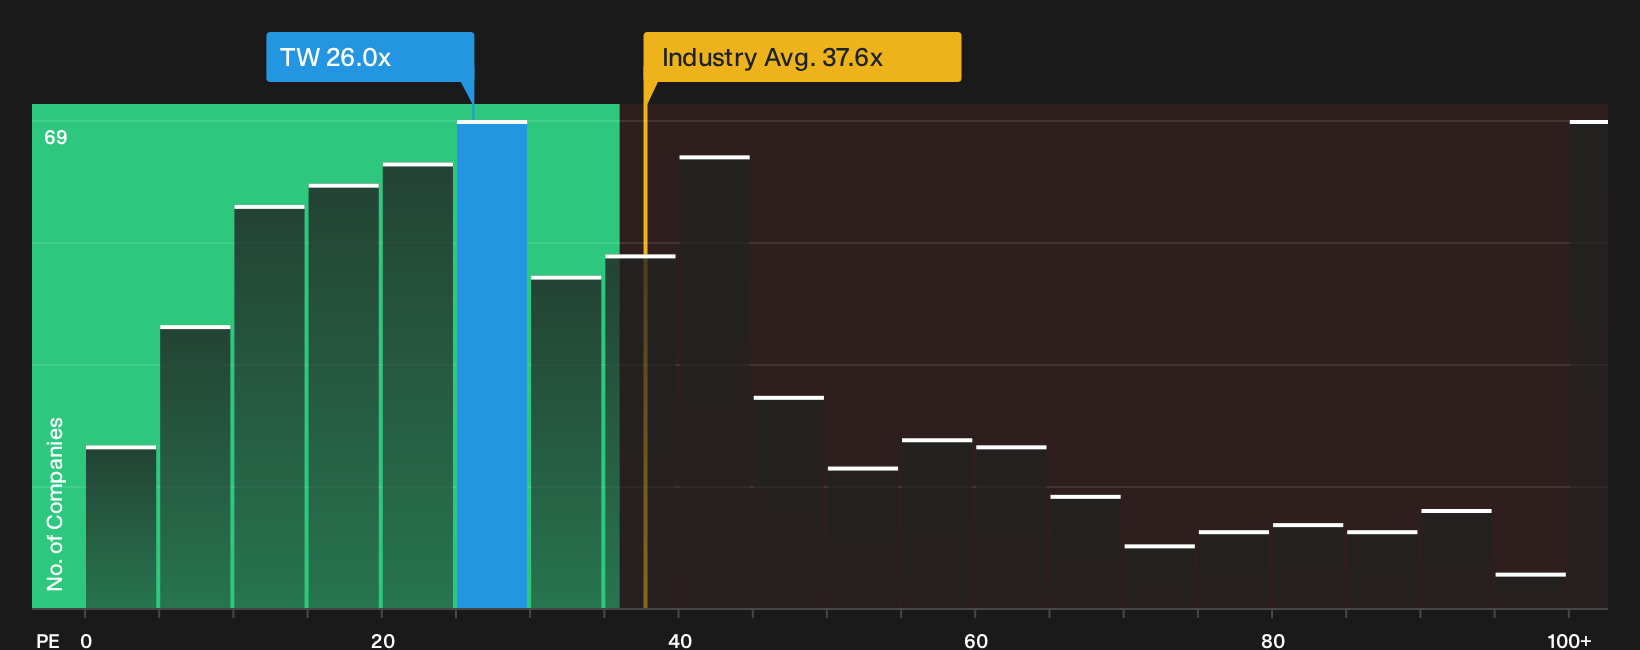
There is a clear split between the narrative fair value of $123.64 and the way simple earnings multiples line up for Tradeweb Markets. The stock trades on a P/E of 25.9x, which is lower than the US Capital Markets average of 37.6x, yet above peers at 24.7x and well above a fair ratio of 14.5x. That gap suggests investors may be paying up for quality and growth while still taking on meaningful valuation risk if expectations cool.
To see how those earnings multiples stack up against detailed fundamentals and where the ratio could shift over time, See what the numbers say about this price — find out in our valuation breakdown..
Simply Wall St performs a discounted cash flow (DCF) on every stock in the world every day (check out Tradeweb Markets for example). We show the entire calculation in full. You can track the result in your watchlist or portfolio and be alerted when this changes, or use our stock screener to discover 32 high quality undervalued stocks. If you save a screener we even alert you when new companies match - so you never miss a potential opportunity.
Next Steps
Sentiment around Tradeweb Markets is split, which is exactly when fresh eyes can matter most. Act while the data is current and evaluate the potential yourself by reviewing the 3 key rewards.
Looking for more investment ideas beyond Tradeweb Markets?
If you stop at Tradeweb Markets, you risk missing other setups that fit your style just as well, or even better, based on hard numbers.
- Target aggressive upside potential by scanning 11 elite penny stocks with strong financials. These already back their low share prices with stronger balance sheets and cleaner financials than many expect.
- Zero in on value by using the 32 high quality undervalued stocks to filter for businesses where quality fundamentals and pricing look out of sync.
- Prioritize staying power and sleep-at-night resilience with the 32 resilient stocks with low risk scores, which highlights stocks with sturdier financial profiles and lower overall risk scores.
This article by Simply Wall St is general in nature. We provide commentary based on historical data and analyst forecasts only using an unbiased methodology and our articles are not intended to be financial advice. It does not constitute a recommendation to buy or sell any stock, and does not take account of your objectives, or your financial situation. We aim to bring you long-term focused analysis driven by fundamental data. Note that our analysis may not factor in the latest price-sensitive company announcements or qualitative material. Simply Wall St has no position in any stocks mentioned.
Have feedback on this article? Concerned about the content? Get in touch with us directly. Alternatively, email editorial-team@simplywallst.com