
Wondering Why Lindt Fell? Here's What The Bears Saw
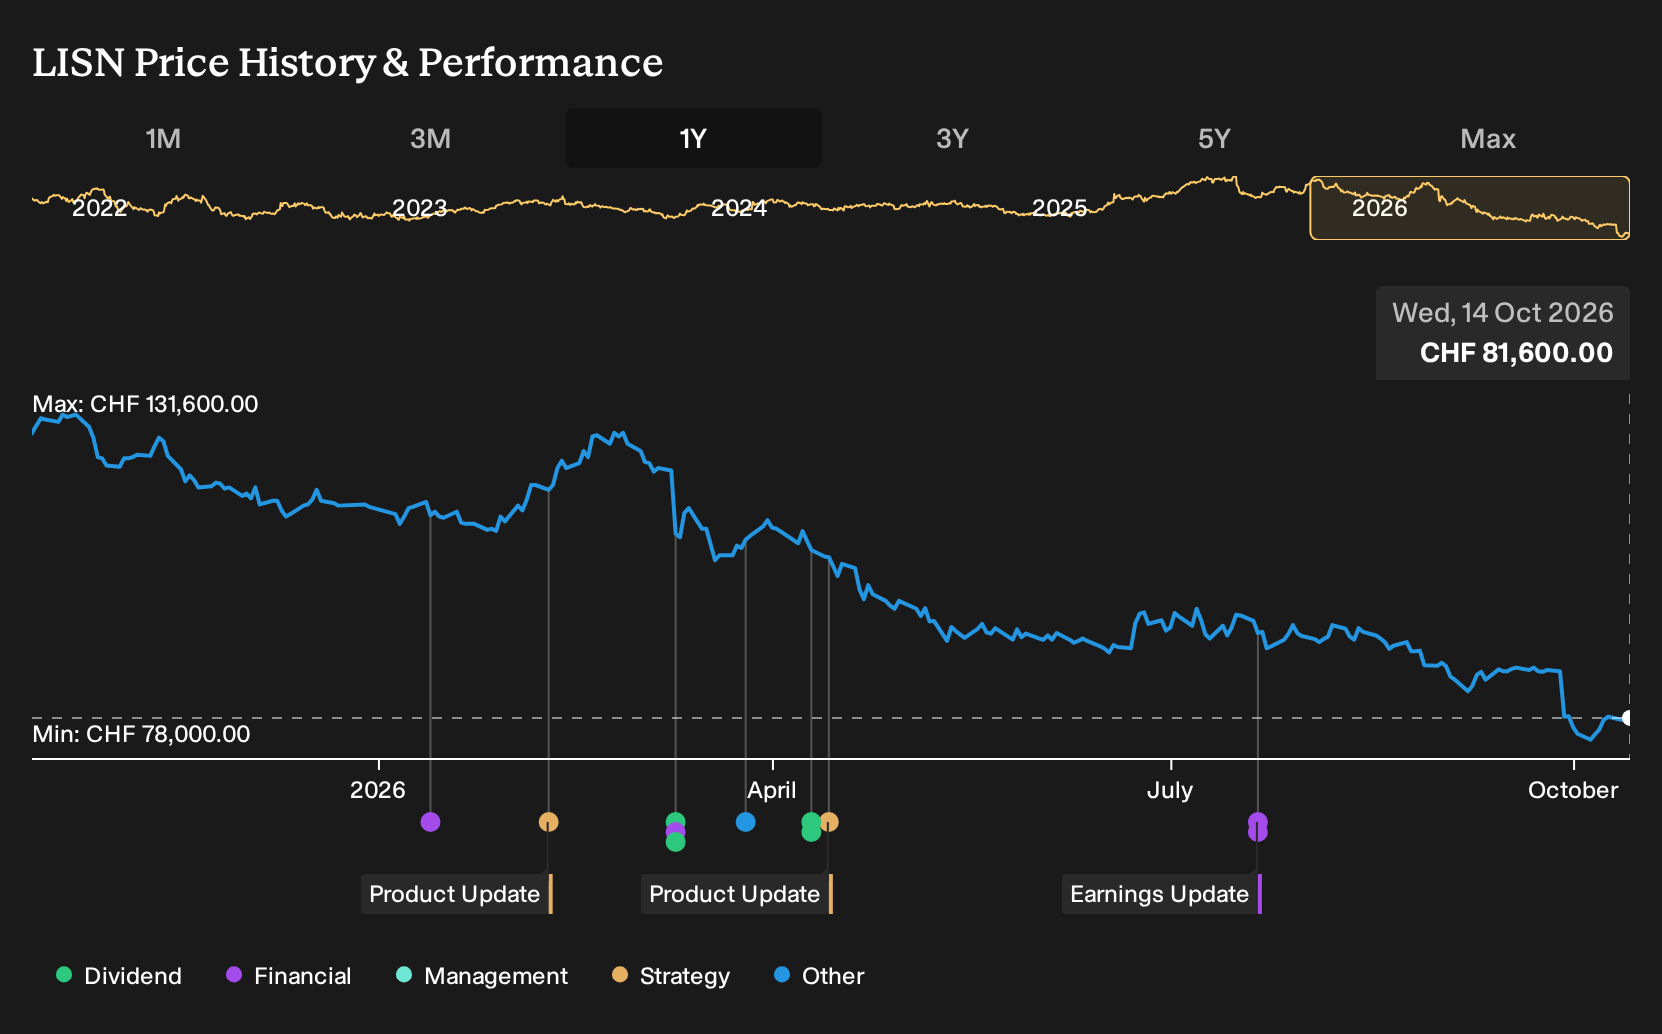
If you had been weighing Chocoladefabriken Lindt & Sprüngli against other consumer brands last October and decided to sit it out, the outcome since then looks harsh on those who stayed in. Holding Chocoladefabriken Lindt & Sprüngli over the past year would have meant a 36.1% loss, including dividends. That gap between expectation and reality raises a pointed question. Which assumptions on revenue growth, margins, or valuation were already on record that could have prompted a harder look at the risk?
The easy part of this move is behind Chocoladefabriken Lindt & Sprüngli. Zero in on 188 high quality undervalued stocks for companies trading below our estimates.
The Argument You Would Have Been Weighing On Chocoladefabriken Lindt & Sprüngli
The shares cost CHF128,600 at the start of the period, and anyone looking at Chocoladefabriken Lindt & Sprüngli then faced two very different stories built on the same set of facts.
The bullish narrative pointed to a Fair Value of CHF147,000, essentially the price implied if 8.7% revenue growth and a 13.0% profit margin materialised over three years. That view leaned on premium chocolate gaining ground through direct-to-consumer channels and a rising middle class in countries like Brazil, China, Saudi Arabia, and India.
The cautious camp saw a Fair Value of CHF120,706 and treated that as the outcome if 6.6% revenue growth and a 12.8% margin played out instead. This mindset put more weight on risks such as persistently high cocoa costs and tighter consumer budgets potentially limiting how far Chocoladefabriken Lindt & Sprüngli could keep lifting prices without losing volume.
What The Results Changed For Chocoladefabriken Lindt & Sprüngli
The key fresh fact for Chocoladefabriken Lindt & Sprüngli was the H1 2026 report. Revenue slipped from CHF2,369.5m to CHF2,365.7m, while net income edged up from CHF188.9m to CHF192.2m and net margin ticked from 8.0% to 8.1%. That mix of softer sales and slightly stronger profitability cut both ways for the original bull and bear cases.
The take-away is clear. When an argument leans on faster growth and higher profitability, track both the revenue line and net margin in each set of results instead of relying on a single headline earnings figure.
What You Would Be Paying For In Chocoladefabriken Lindt & Sprüngli Today
With Chocoladefabriken Lindt & Sprüngli now at CHF81,600, this Narrative still places its Fair Value above the current market price. The focus is on premium chocolate, gifting, and new product formats to support brand strength and revenue momentum.
The Narrative relies on expansion in direct-to-consumer channels and newer markets to support margins despite higher input costs. A buyer today would be leaning on the assumption that premium positioning and pricing power can offset persistent cocoa and volume pressure.
"Geographic diversification is accelerating with double-digit growth in emerging markets like Japan, Brazil, South Africa, and China, and robust plans to expand distribution and direct-to-consumer channels, supporting both future top-line growth and reduced dependency on mature core markets."
One Narrative has put a figure on that disagreement. → See the Narrative with its higher Fair Value, assumptions and all
Before The Next Story Makes Headlines
The next headline does not have to be where your research begins. Go straight to the companies and see whether a contrarian opportunity could be taking shape.
- Company 1 - 49% below our estimate - targets long-duration data center and power projects backed by contracted work.
- Company 2 - 35% below our estimate - scales fee-earning assets by expanding into underpenetrated energy transition investment vehicles.
- Company 3 - 45% below our estimate - expands omnichannel retail reach through new flagship locations and increased digital initiatives.
That is three of the list. See every one of the 203 solid balance sheet companies →
This article by Simply Wall St is general in nature. We provide commentary based on historical data and analyst forecasts only using an unbiased methodology and our articles are not intended to be financial advice. It does not constitute a recommendation to buy or sell any stock, and does not take account of your objectives, or your financial situation. We aim to bring you long-term focused analysis driven by fundamental data. Note that our analysis may not factor in the latest price-sensitive company announcements or qualitative material. Simply Wall St has no position in any stocks mentioned.
Have feedback on this article? Concerned about the content? Get in touch with us directly. Alternatively, email editorial-team@simplywallst.com