
TSI HoldingsLtd (TSE:3608) Stock Sees Sales Strength Clash With Deeper Losses
TSI HoldingsLtd stock has been drifting higher in recent weeks, yet today’s earnings story cuts in a different direction. The apparel group swung to a quarterly loss of ¥985 million in Q2 2027 on revenue of ¥42,626 million, a setback that jars against the upbeat share price and the richer 19.9x trailing P/E investors are currently paying.
That squeeze on profitability is the headline. For anyone with a longer horizon, the key question now is how this margin pressure squares with the optimistic multi year earnings forecasts and a discounted cash flow value that still sits far above today’s ¥1,275 price.
Is TSI HoldingsLtd a genuine bargain given the large gap between its current ¥1,275 share price and the DCF estimate, or is the richer 19.9x P/E signaling something different? Compare that disconnect directly in the valuation analysis for TSI HoldingsLtd.Q2 2027 Earnings Summary
- Revenue (Q2 2027 vs. Q2 2026): ¥42,626 million vs. ¥30,562 million (higher revenue compared with the prior comparable quarter)
- Net Income/Loss (Q2 2027 vs. Q2 2026): loss of ¥985 million vs. loss of ¥653 million (larger quarterly loss year on year)
- Basic EPS (Q2 2027 vs. Q2 2026): loss of ¥17.53 per share vs. loss of ¥10.02 per share (deeper per share loss than the prior year)
- Trailing 12 Month Net Income (TTM to Q2 2027 vs. TTM to Q2 2026): ¥3,597 million vs. ¥17,334 million (significantly lower cumulative profit over the last year)
Prefer clean, visual charts over wading through dense tables of figures and footnotes? See TSI HoldingsLtd’s full financial picture, including how its valuation compares with recent profitability trends, in the interactive company report for TSI HoldingsLtd.
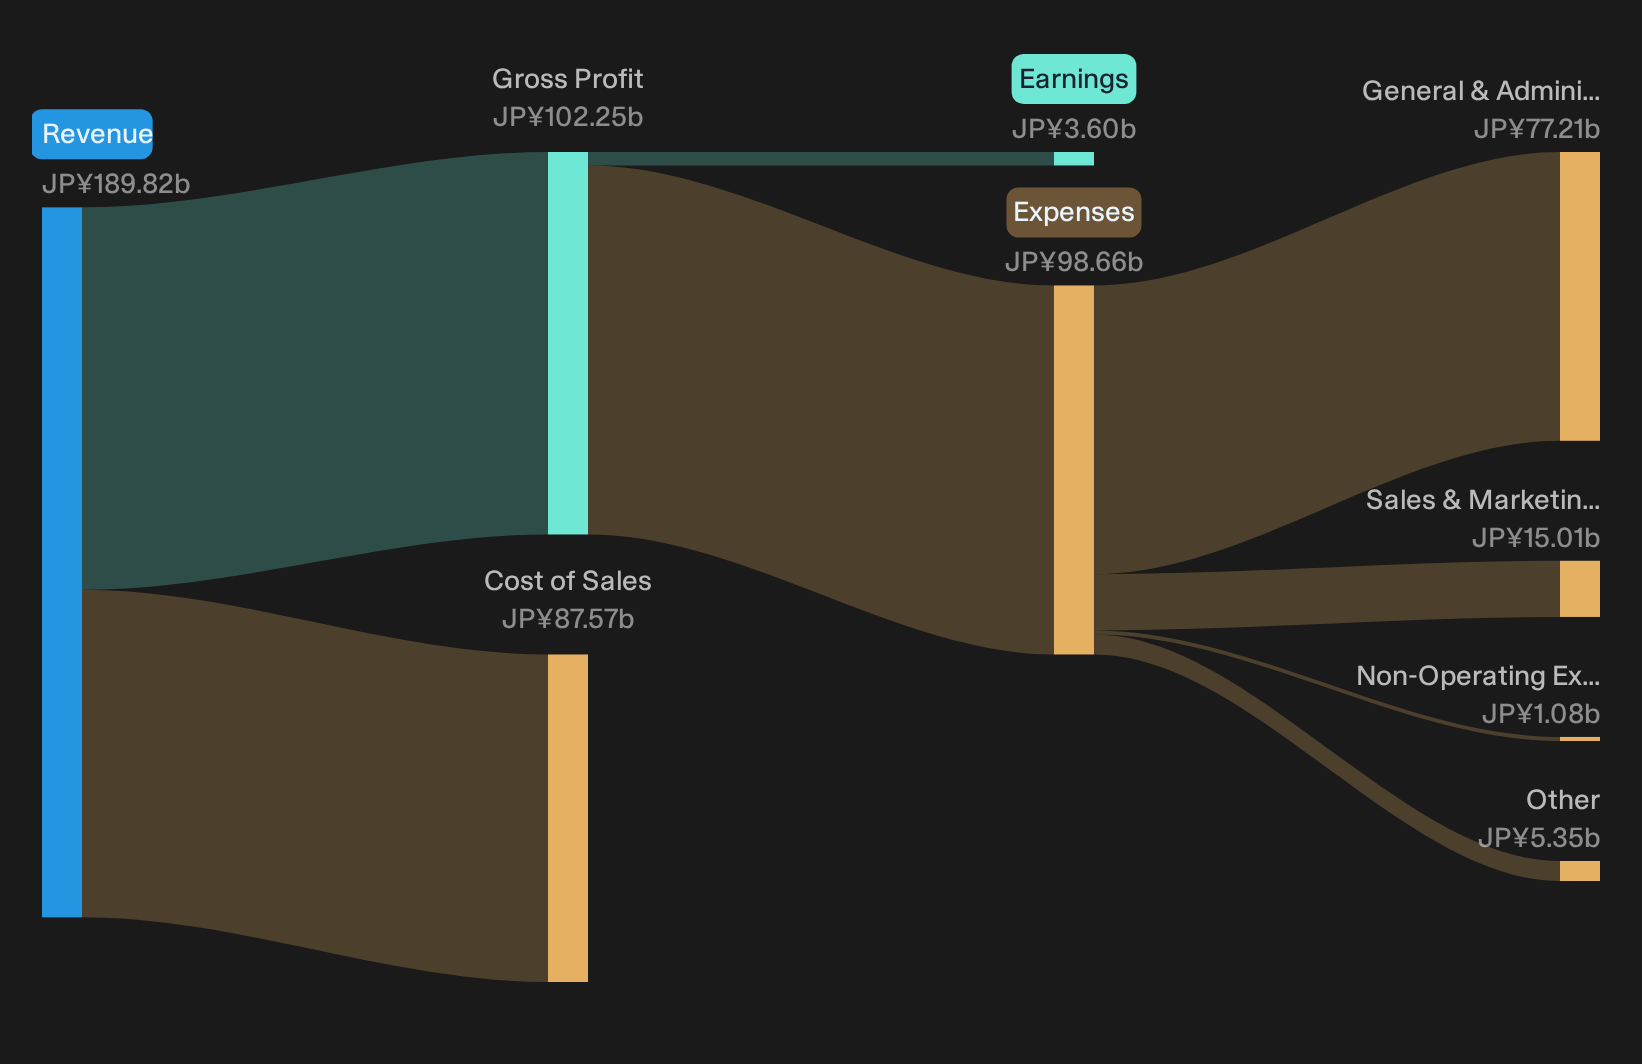
TSI bullish story leans on scale and resilience
For a constructive view on TSI Holdings Ltd, the appeal rests on scale and breadth. Revenue of ¥42,626 million in Q2 2027 sits well above the prior year’s quarterly level, which supports the idea that the broader lifestyle portfolio can still attract spend. Recent 7 day, 30 day and 90 day share price gains also indicate investors have not abandoned that narrative. The challenge is clear, but buyers looking at the group as a diversified consumer platform can still point to a business that is generating sizeable top line activity.
Profit stress keeps the cautious TSI narrative alive
The more cautious story around TSI Holdings Ltd finds plenty of backing in these results. The group reported a quarterly loss of ¥985 million and a deeper basic loss per share year on year. Trailing 12 month net income of ¥3,597 million is far below the prior year’s figure, which underlines pressure on earnings quality. Rising sales without matching profit progress fit concerns about a complex portfolio struggling to convert activity into cash. For investors worried about fashion sector margins, this print keeps execution risk very much in view.
Access where the surface looks calm, but the models start to disagree on TSI HoldingsLtd’s next big swing by checking what the street is quietly baking into revenue, margin and EPS paths in the analyst estimates for TSI HoldingsLtd.
Stay Ahead With Simply Wall St
TSI HoldingsLtd now trades on a richer P/E multiple while earnings have come under pressure, which makes timing your entry critical. Register for free with Simply Wall St and add it to your Watchlist to track the share price against fair value and spot when the risk and reward start to line up. After you own it, keep your decisions focused with the Portfolio Command Center that cuts through noise and flags the updates that matter for your holdings. Round out your view by tapping into thousands of investor opinions through the Community so you can surface potential catalysts or risks early and stay a step ahead of the market.
Seeking Alternatives Beyond TSI HoldingsLtd?
Fresh ideas move first when momentum builds and potential breakouts are still flying under the radar for now. Scan these curated shortlists before the best entry points get caught. Act now.
- Spot potential cash rich compounders early by running through a curated 16 high quality undervalued stocks while pricing dislocations still matter and sentiment has not fully adjusted.
- Track the next wave of automation winners by scanning the hand picked 91 robotics and automation stocks before broader indexes start reflecting their progress and narrow your opportunity window.
- Zero in on resilient balance sheets by working through the curated list of solid balance sheet and fundamentals stocks (21 results) while these sturdier businesses remain priced as if they are ordinary.
This article by Simply Wall St is general in nature. We provide commentary based on historical data and analyst forecasts only using an unbiased methodology and our articles are not intended to be financial advice. It does not constitute a recommendation to buy or sell any stock, and does not take account of your objectives, or your financial situation. We aim to bring you long-term focused analysis driven by fundamental data. Note that our analysis may not factor in the latest price-sensitive company announcements or qualitative material. Simply Wall St has no position in any stocks mentioned.
Have feedback on this article? Concerned about the content? Get in touch with us directly. Alternatively, email editorial-team@simplywallst.com