
Fuji (TSE:8278) Climbed, But What Is Behind The Latest Attention?
Fuji (TSE:8278) has come into focus after half year earnings showed lower sales of ¥393,366 million compared with ¥403,236 million a year earlier, while net income and earnings per share both moved higher.
At a share price of ¥1,938, Fuji has seen a 1-day share price return of 2.27% and a 7-day gain of 0.99%, although the 30-day share price return fell 7.27% and is down 8.80% year to date. That short term weakness contrasts with a 1-year total shareholder return of 0.23% and 11.16% over three years, which points to fading momentum recently as investors weigh earnings and a steady dividend against the earlier share price performance.
Scan how Fuji’s mix of softer sales, firmer earnings and a held dividend compares with other retailers by checking out list of solid balance sheet and fundamentals (21 results) in the same corner of the market.
Fuji now trades slightly below one intrinsic value estimate after a mixed share price record. Is that a reasonable safety margin, or a sign the market doubts those firmer earnings and maintained dividend?
Price-to-Earnings of 19.4x: Is it justified?
Fuji trades on a P/E of 19.4x at a last close of ¥1,938, which places the stock on a richer valuation than many Consumer Retailing peers.
The P/E ratio compares the current share price with earnings per share. For a retailer like Fuji, it gives a quick sense of how much investors are willing to pay for each unit of profit, which can reflect expectations around earnings stability, growth potential, or perceived risk.
Here, the gap is clear. Fuji’s 19.4x multiple sits well above both the JP Consumer Retailing industry average of 12.8x and the peer group average of 13.1x. That sort of premium signals the market is pricing in stronger or more reliable earnings than the wider sector, even though net profit margins are currently low at 1.1% and the latest DCF work suggests limited support from projected cash flows.
Result: Price-to-Earnings of 19.4x (OVERVALUED).
See what the numbers say about this price — find out in our valuation breakdown.
Still, investors need to watch for any pressure on Fuji’s already thin 1.1% net margin and the possibility that a higher P/E multiple contracts if sentiment cools.
Find out about the key risks to this Fuji narrative.
Another View: What Fuji’s DCF Says
The SWS DCF model paints a very different picture for Fuji. With the share price at ¥1,938 and an estimated future cash flow value of ¥739.64, the stock screens as expensive on this framework, even before thinking about earnings momentum or dividend support.
For anyone weighing how much weight to give that gap, Look into how the SWS DCF model arrives at its fair value.
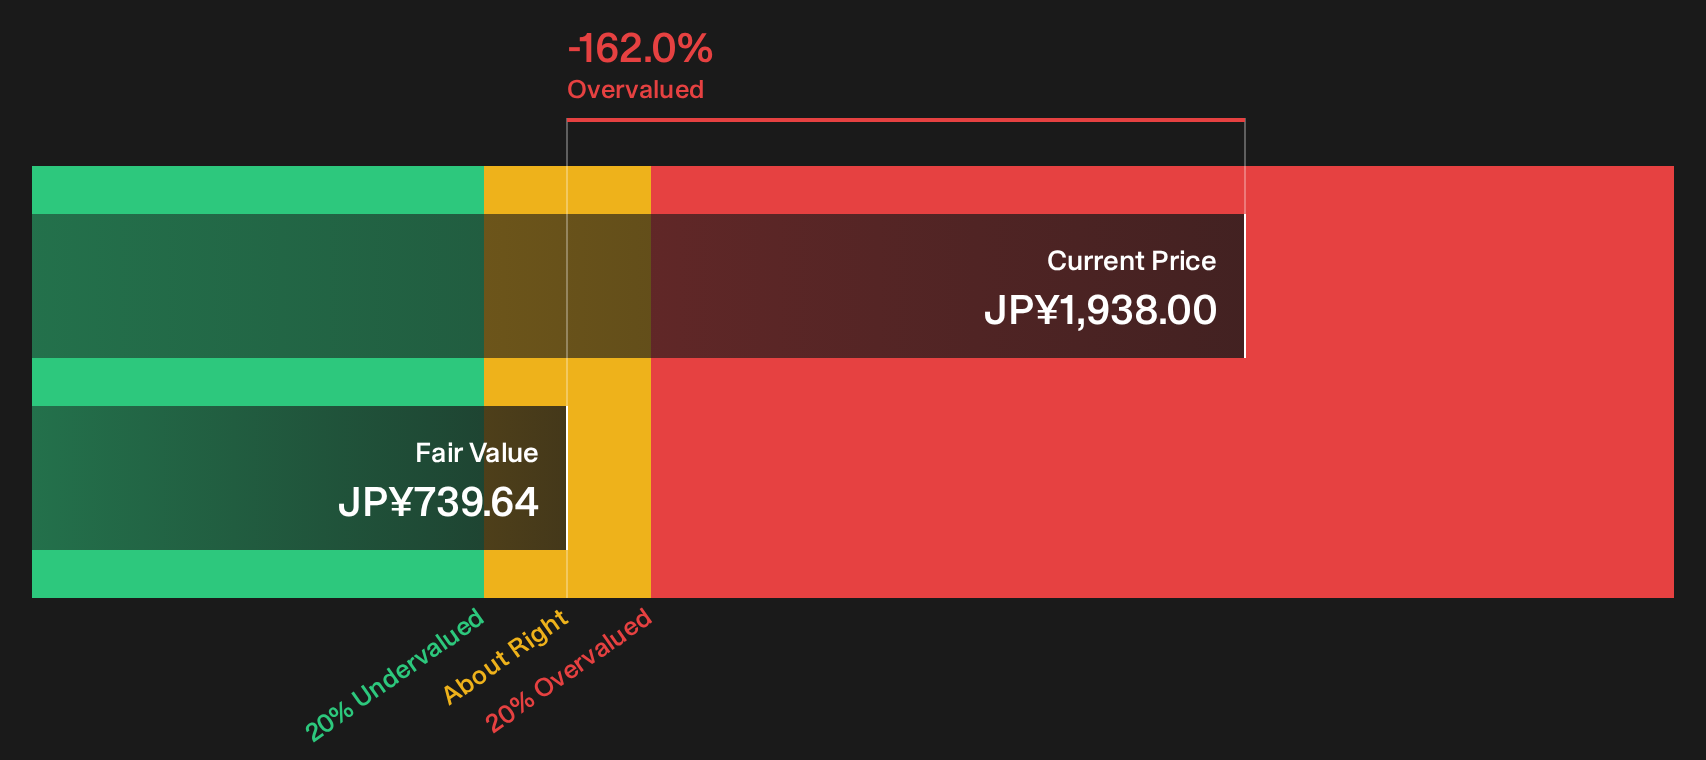
Simply Wall St performs a discounted cash flow (DCF) on every stock in the world every day (check out Fuji for example). We show the entire calculation in full. You can track the result in your watchlist or portfolio and be alerted when this changes, or use our stock screener to discover 16 high quality undervalued stocks. If you save a screener we even alert you when new companies match - so you never miss a potential opportunity.
Next Steps
Mixed signals on Fuji can feel confusing, so use that tension as a prompt to review the underlying data, check the assumptions, and decide whether the optimism around at least one identified reward lines up with your own risk tolerance by starting with the 1 key reward.
Looking for more Fuji investment ideas?
If Fuji has you rethinking what belongs in your portfolio, do not stop here. The next upgrade to your watchlist could be sitting in plain sight.
- Target stronger pricing power and balance sheet quality by scanning a curated 16 high quality undervalued stocks that filters for both fundamentals and valuation support.
- Dial up income potential and stability by reviewing a focused set of 31 dividend fortresses that may suit long term payout hunters.
- Protect your downside first by screening for 22 resilient stocks with low risk scores built around resilient earnings profiles and sturdier financial positions.
This article by Simply Wall St is general in nature. We provide commentary based on historical data and analyst forecasts only using an unbiased methodology and our articles are not intended to be financial advice. It does not constitute a recommendation to buy or sell any stock, and does not take account of your objectives, or your financial situation. We aim to bring you long-term focused analysis driven by fundamental data. Note that our analysis may not factor in the latest price-sensitive company announcements or qualitative material. Simply Wall St has no position in any stocks mentioned.
Have feedback on this article? Concerned about the content? Get in touch with us directly. Alternatively, email editorial-team@simplywallst.com