
Takashimaya (TSE:8233) Stock Can Q2 Earnings Revive A Repair Story?
Takashimaya just reported Q2 2027 earnings and the story is more about pressure than progress. The stock closed today at ¥2,153.5, after drifting higher over the past month, yet the retailer is still loss making on a trailing twelve month basis and paying a dividend that recent earnings do not comfortably cover. Net income for the quarter landed at ¥4,932 million, positive but sitting against a twelve month loss of ¥13,399 million. This is a sentiment test. Traders are treating Takashimaya like a recovery story while the income statement still reads like a repair job.
Like the Takashimaya recovery story but concerned that recent losses and dividend coverage risk could keep pressure on the shares? Compare this setup with our screener of list of solid balance sheet and fundamentals stocks (21 results).
Q2 2027 Earnings Summary
- Total Revenue (Q2 2027 vs Q2 2026): ¥147,944 million vs. ¥144,538 million (modest year on year increase in quarterly sales)
- Net Income (Excl. Extra Items) (Q2 2027 vs Q2 2026): ¥4,932 million vs. ¥14,223 million (quarterly profit declined compared with the prior comparable period)
- Basic EPS (Q2 2027 vs Q2 2026): ¥16.83 per share vs. ¥47.15 per share (earnings per share weakened on a quarterly year on year basis)
- Trailing 12M Net Income (Excl. Extra Items) to Q2 2027 vs TTM to Q2 2026: loss of ¥13,399 million vs. profit of ¥41,666 million (moved from trailing profit to trailing loss over the year)
Ask Charlie what Takashimaya’s profit turnaround odds really are.
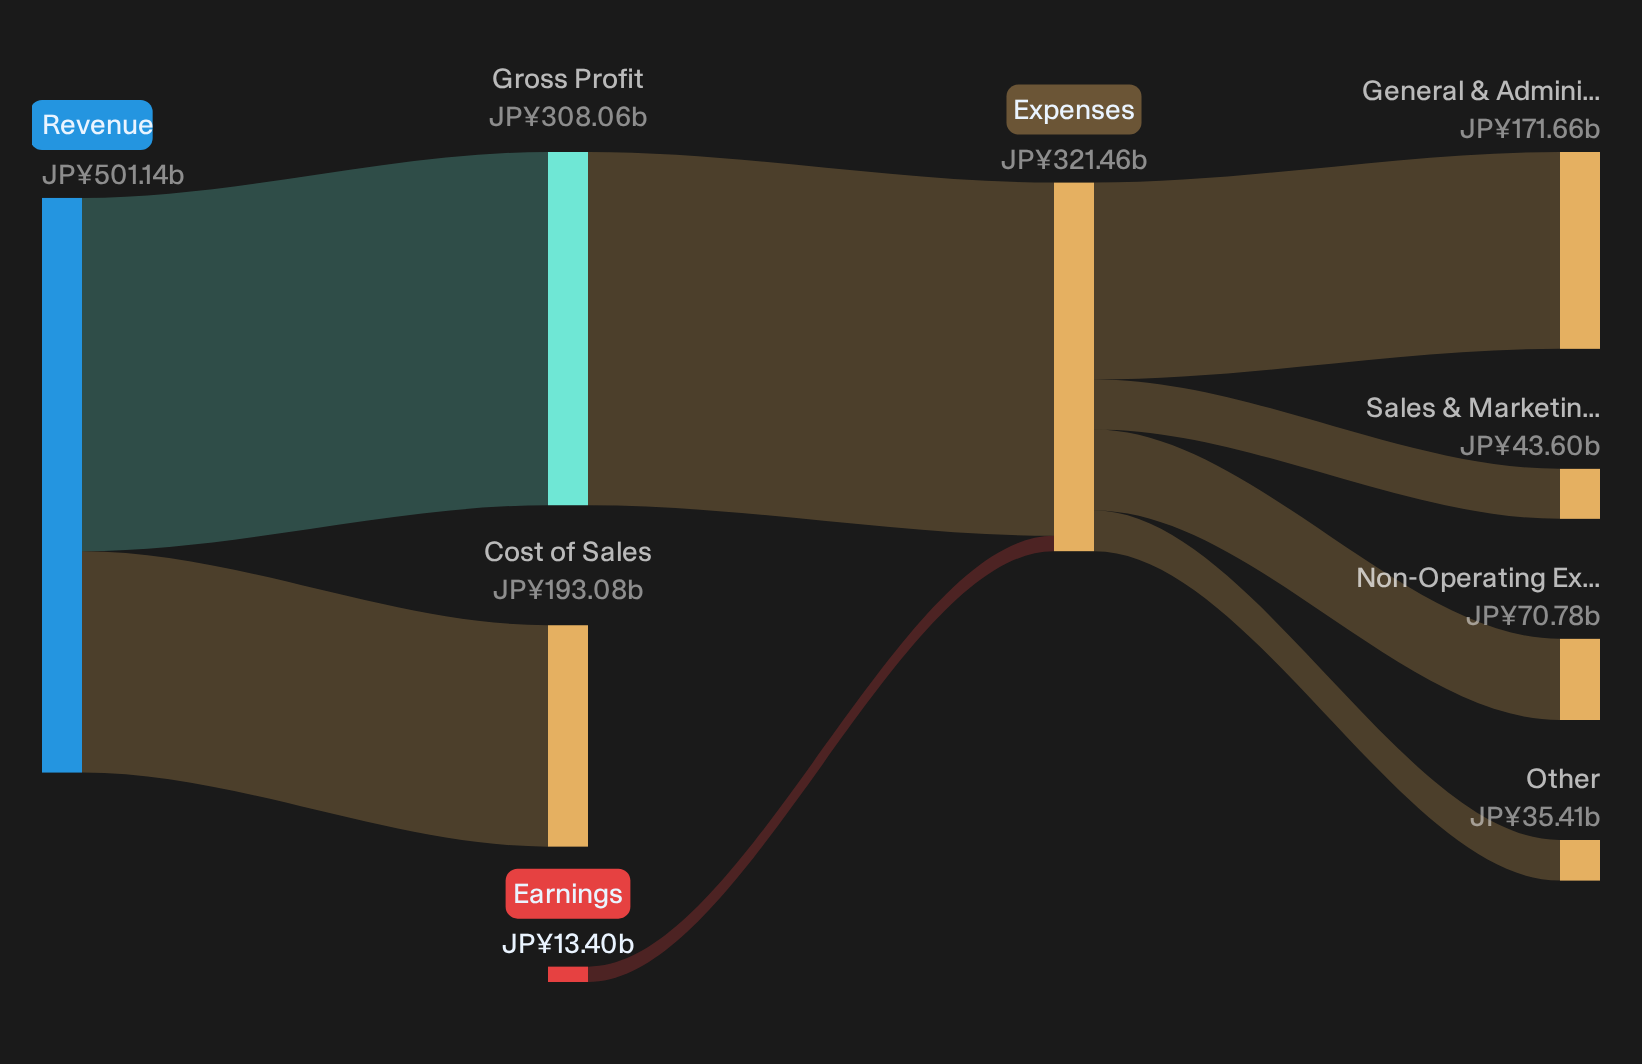
Takashimaya’s recovery story meets mixed earnings reality
Bulls point to Takashimaya as a resilient, asset backed retailer that can grind through retail noise. There is some support for that view. Quarterly revenue reached ¥147,944 million, slightly ahead of the prior year’s ¥144,538 million, and Q2 delivered a profit of ¥4,932 million. The business is still generating cash flow from customers and keeping the brand relevant. For a recovery angle, that matters more than a single soft quarter, because it shows the commercial engine is still running rather than stalling completely.
Loss making trend and dividend strain keep pressure high
The harsher read is hard to ignore. Net income in Q2 dropped from ¥14,223 million a year ago to ¥4,932 million, so profitability moved the wrong way even as sales edged up. Over the last twelve months Takashimaya recorded a loss of ¥13,399 million after a prior trailing profit of ¥41,666 million. That sits awkwardly against a dividend that recent earnings do not comfortably cover. The share price rise over the past month suggests some optimism, but the numbers still look like a business in repair rather than clear recovery.
Are investors right to treat Takashimaya Company as a recovery story while the income statement still looks like a repair job, or are analysts more cautious about where TSE:8233 goes from here? Check the consensus price target analysis for Takashimaya Company.Hunt For Quieter Repair Stories
Takashimaya Company just reminded investors that share prices can drift away from messy repair work underneath. The real opportunity sits with businesses that could be undervalued before more investors run the numbers.
- Company 1 - 35% below our estimate - targets large infrastructure clients needing one contractor for complex construction, reinforcement and long term maintenance cycles.
- Company 2 - 19% below our estimate - builds income streams by structuring real estate projects bundling power assets, logistics hubs and hospitality into recurring fee platforms.
- Company 3 - 36% below our estimate - expands a nationwide footprint of car sites capturing customers from purchase through inspection, repair, insurance and eventual resale.
That is three of the list. See the full list of 14 companies trading below our fair value estimates →
This article by Simply Wall St is general in nature. We provide commentary based on historical data and analyst forecasts only using an unbiased methodology and our articles are not intended to be financial advice. It does not constitute a recommendation to buy or sell any stock, and does not take account of your objectives, or your financial situation. We aim to bring you long-term focused analysis driven by fundamental data. Note that our analysis may not factor in the latest price-sensitive company announcements or qualitative material. Simply Wall St has no position in any stocks mentioned.
Have feedback on this article? Concerned about the content? Get in touch with us directly. Alternatively, email editorial-team@simplywallst.com