
SAN Holdings (TSE:9628) Q4 Results Expose Profit Quality Debate
San Holdings just reported Q4 2026 results with basic earnings per share of ¥136.97, and the stock closed today at ¥1,330 after only a mild drift in recent weeks. That calm finish hides a sharp sentiment debate. On one side sit investors eyeing a trailing P/E of 9.8x against a dividend yield of 3.03%. On the other sits a crowd focused on compressed profitability, with trailing net margin at 7.9% and flattered by a ¥1.5b one off gain. Today’s price looks less like panic or euphoria and more like a tug of war over earnings quality.
Like the income today on SAN Holdings but uneasy about how much of it came from that ¥1.5b one off gain and a thinner 7.9% net margin? Compare this with companies that pair solid earnings quality with stronger balance sheets using our list of solid balance sheet and fundamentals stocks (21 results)
Q4 2026 Earnings Summary
- Revenue (Q4 2026 vs. Q4 2025): ¥10,064 million vs. ¥11,215 million (down 10.3%)
- Net Income (Excl. Extra Items, Q4 2026 vs. Q4 2025): ¥3,112 million vs. ¥3,250 million (down 4.2%)
- Basic EPS (Q4 2026 vs. Q4 2025): ¥136.97 vs. ¥158.83 (down 13.8%)
- Trailing Net Profit Margin (Last 12 Months vs. Prior Year): 7.9% vs. 12.4% (margin compressed, includes ¥1.5b one off gain)
Ask Charlie what SAN Holdings' low P/E might be missing.
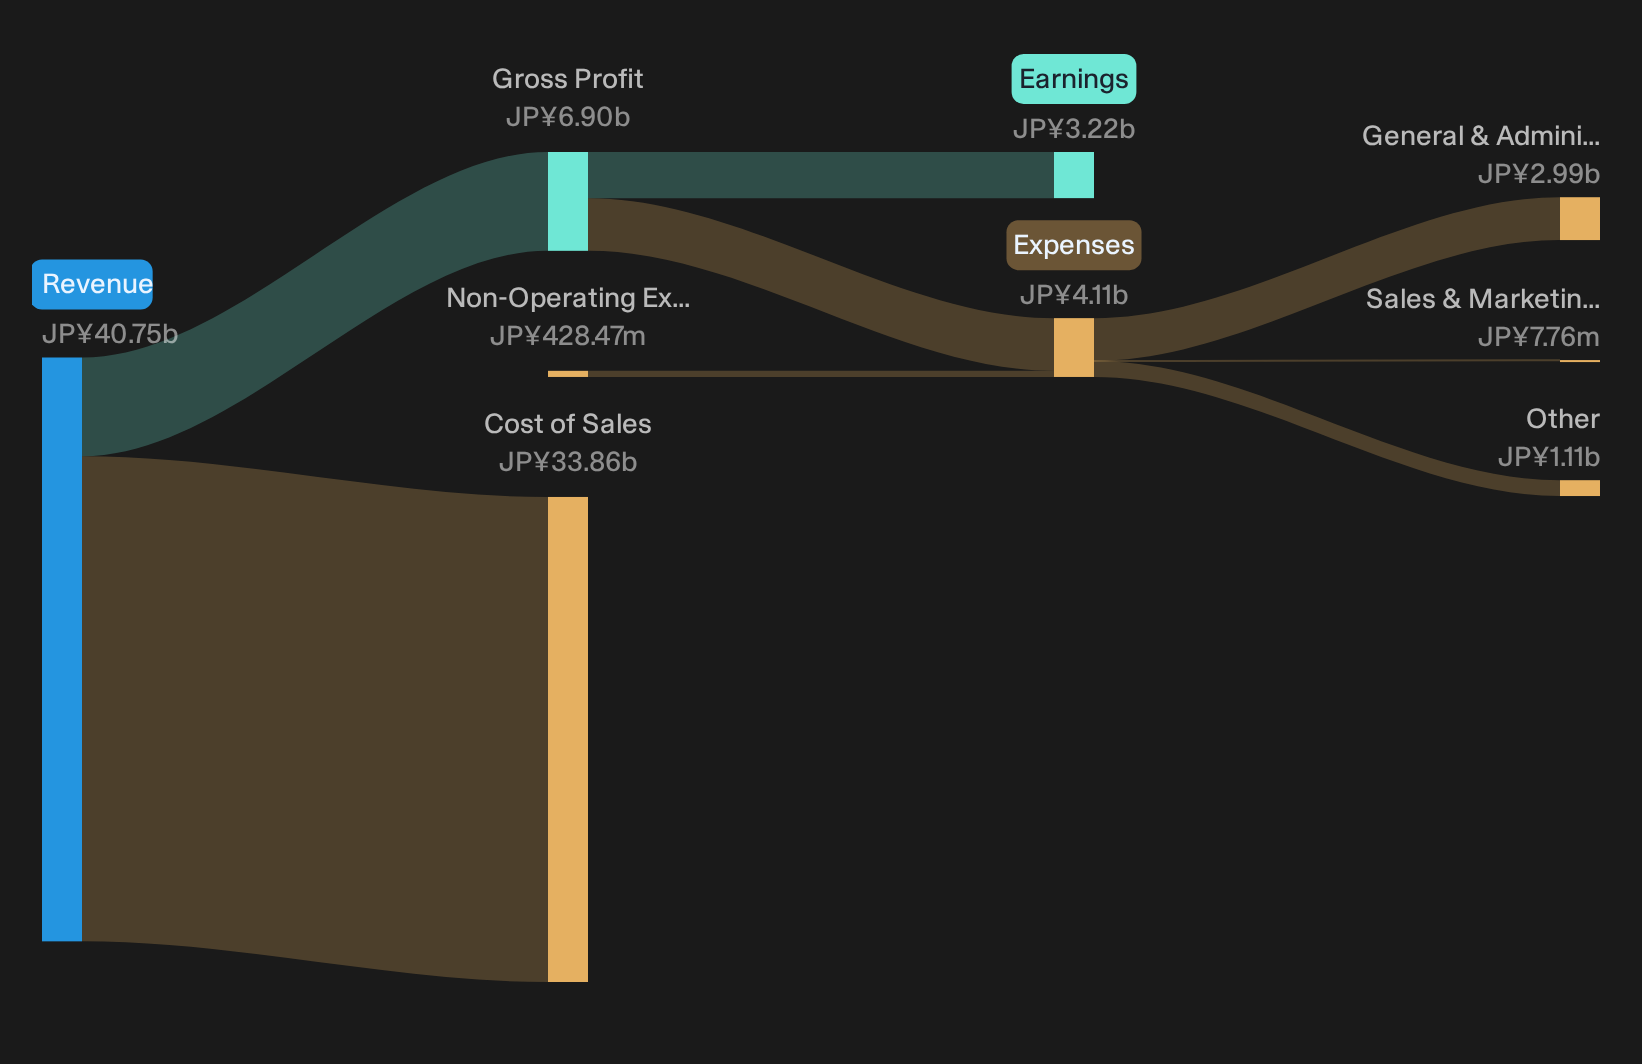
San Holdings: Income Appeal Faces Mixed Support
For investors drawn to San Holdings for stability and income, the latest quarter partly supports that view. Net income excluding extra items at ¥3,112 million held closer to flat than revenue, which moved from ¥11,215 million to ¥10,064 million. That gap hints at some resilience in the underlying earnings engine. A 7.9% trailing net margin, while thinner than before, still leaves room for dividend capacity, which keeps the income narrative alive even as growth cools.
Earnings Quality Questions Gain More Traction
The cautious story also has fresh backing. Revenue falling 10.3% while basic EPS slid from ¥158.83 to ¥136.97 shows pressure on both scale and per share profitability. The 7.9% trailing margin is materially below the prior 12.4%, and that compressed level is supported by a ¥1.5b one off gain. That mix points to softer core profitability and heightens scrutiny on how repeatable current earnings really are for San Holdings.
After a year where profit margins slid from 12.4% to 7.9% and one off gains did the heavy lifting, it is fair to ask if this is a one quarter quirk or a structural shift in how SAN Holdings earns money. Before assuming the risk picture is contained, review an independent risk analysis for SAN Holdings which shows 3 important warning signsHunt For Quiet Mispricings Now
SAN Holdings recently reported results that highlight how earnings quality and stock pricing can diverge. The real opportunity is studying fundamentals to find stocks that may be quietly undervalued before attention returns.
- Company 1 - 35% below our estimate - focuses on complex infrastructure builds that clients bundle with long term maintenance and seismic upgrade contracts.
- Company 2 - 20% below our estimate - supplies advanced grinding tools and ceramics that large manufacturers adopt when upgrading production lines to tighter tolerances.
- Company 3 - 46% below our estimate - sells molding machines that beverage brands use when consolidating plastic bottle production onto flexible, higher throughput lines.
Those are three of them. See all 14 potentially undervalued companies →
This article by Simply Wall St is general in nature. We provide commentary based on historical data and analyst forecasts only using an unbiased methodology and our articles are not intended to be financial advice. It does not constitute a recommendation to buy or sell any stock, and does not take account of your objectives, or your financial situation. We aim to bring you long-term focused analysis driven by fundamental data. Note that our analysis may not factor in the latest price-sensitive company announcements or qualitative material. Simply Wall St has no position in any stocks mentioned.
Have feedback on this article? Concerned about the content? Get in touch with us directly. Alternatively, email editorial-team@simplywallst.com