
Peyto Exploration & Development And 2 Canadian Dividend Stocks To Own
US government deficits approaching $2t have pushed borrowing costs into sharper focus for income seekers, which turns steady cash payouts into a serious counterweight to headline noise. Canadian dividend stocks that already yield more than 3% and have shown the ability to keep those payments covered and growing offer a way to let volatility work for you. This article highlights three of the strongest options from that group.
The three stocks highlighted here offer a compelling starting point if you want exposure to higher yielding dividend powerhouses where payouts look covered and consistent. However, if you want the absolute best, these 3 dividend aristocrats stocks are the cream of the crop.
Peyto Exploration & Development (TSX:PEY)
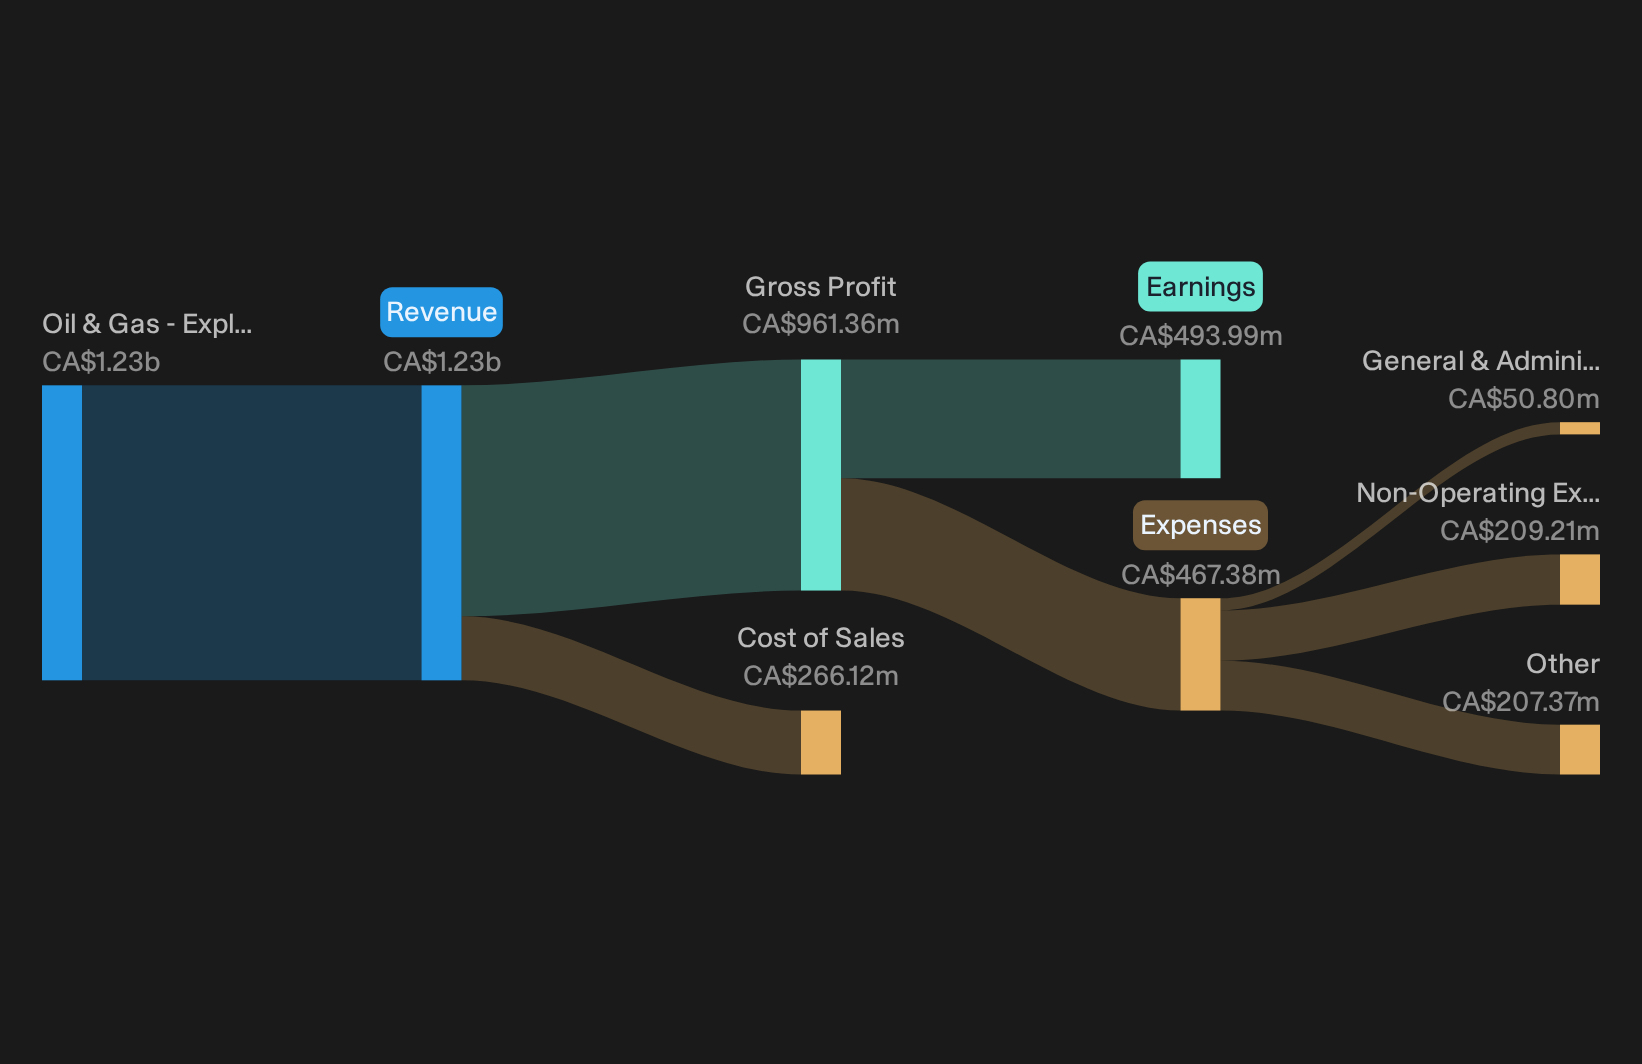
Overview: Peyto Exploration & Development is a Calgary based producer that generates cash flow from exploring, developing and producing natural gas and natural gas liquids in Alberta’s Deep Basin, which underpins its regular dividend payouts for income focused investors.
Operations: Peyto generates about CA$1.2 billion in revenue from oil and gas exploration and production in Canada, entirely driven by its Alberta Deep Basin operations.
Market Cap: CA$5.1 billion
Peyto Exploration & Development matters in this Dividend Powerhouses screen because its Alberta Deep Basin gas wells generate recurring cash that funds a yield above 3%, and recent operating updates indicate that this income engine is playing a larger role in the background.
"Ramp-up of LNG export facilities (notably LNG Canada's commencement of exports) is set to increase long-term demand and support higher benchmark prices for Canadian natural gas, enhancing Peyto's sales volumes and revenue prospects."
What really shapes the outcome for Peyto’s margins and dividend capacity now is how one quiet pressure on its cost base evolves.
If you want to see how that cost pressure could reshape Peyto Exploration & Development’s income profile, read the full narrative for Peyto Exploration & Development for the full picture on risks and upside.
Canadian Tire Corporation (TSX:CTC.A)
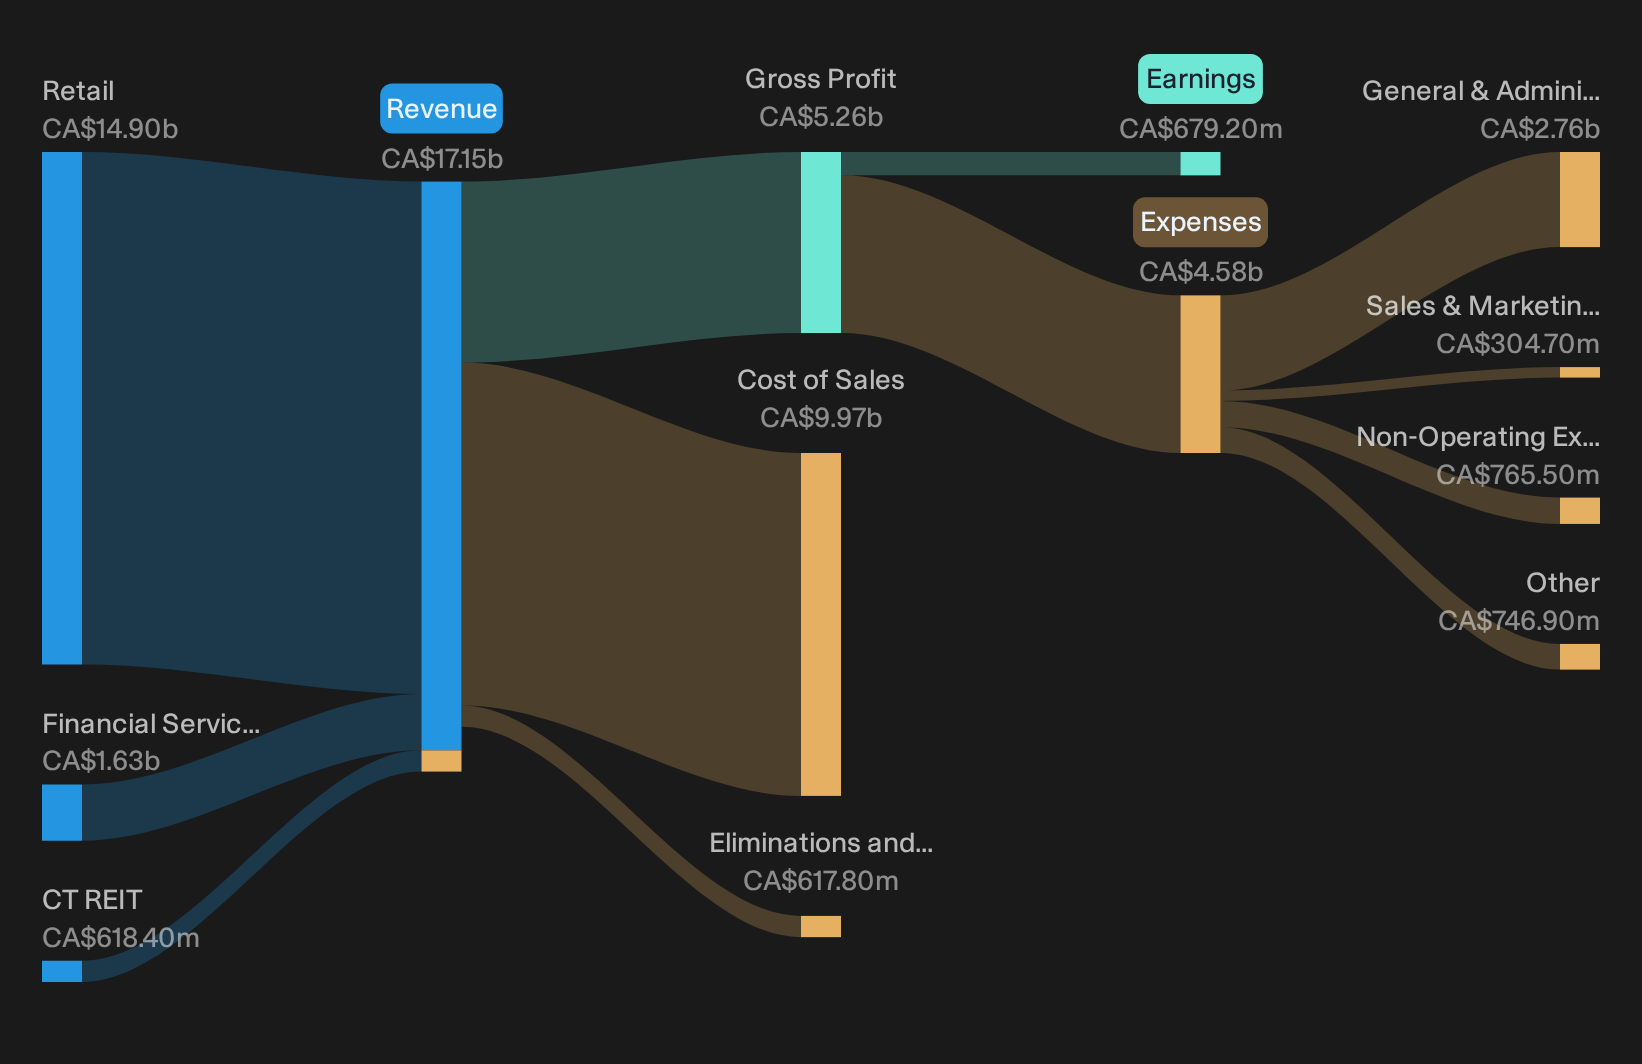
Overview: Canadian Tire Corporation runs a broad Canadian retail network, a real estate trust anchored by its own stores, and a consumer finance operation that together support its dividend profile.
Operations: Canadian Tire Corporation generates about CA$14.9b from Retail, CA$1.6b from Financial Services and CA$618 million from CT REIT, offset by CA$618 million in eliminations and adjustments.
Market Cap: CA$10.6b
Canadian Tire Corporation matters for a Dividend Powerhouses screen because CT REIT’s lease backed income adds a steady layer under a 3%+ yield. The retail and financial arms work to keep that payout supported by day to day Canadian spending.
"The wider rollout of AI pricing and customer analytics tools, such as the platforms used to shape promotions and category occasions, is expected to influence assortment, promo intensity and regular pricing in ways that support gross margin and earnings quality."
What ultimately keeps this dividend profile attractive is how one quiet shift in cash generation and funding costs resolves over the next few years.
That quiet funding shift is exactly what the full narrative for Canadian Tire Corporation unpacks, highlighting where Canadian Tire Corporation’s income engine could be stalling or quietly accelerating next.
Freehold Royalties (TSX:FRU)
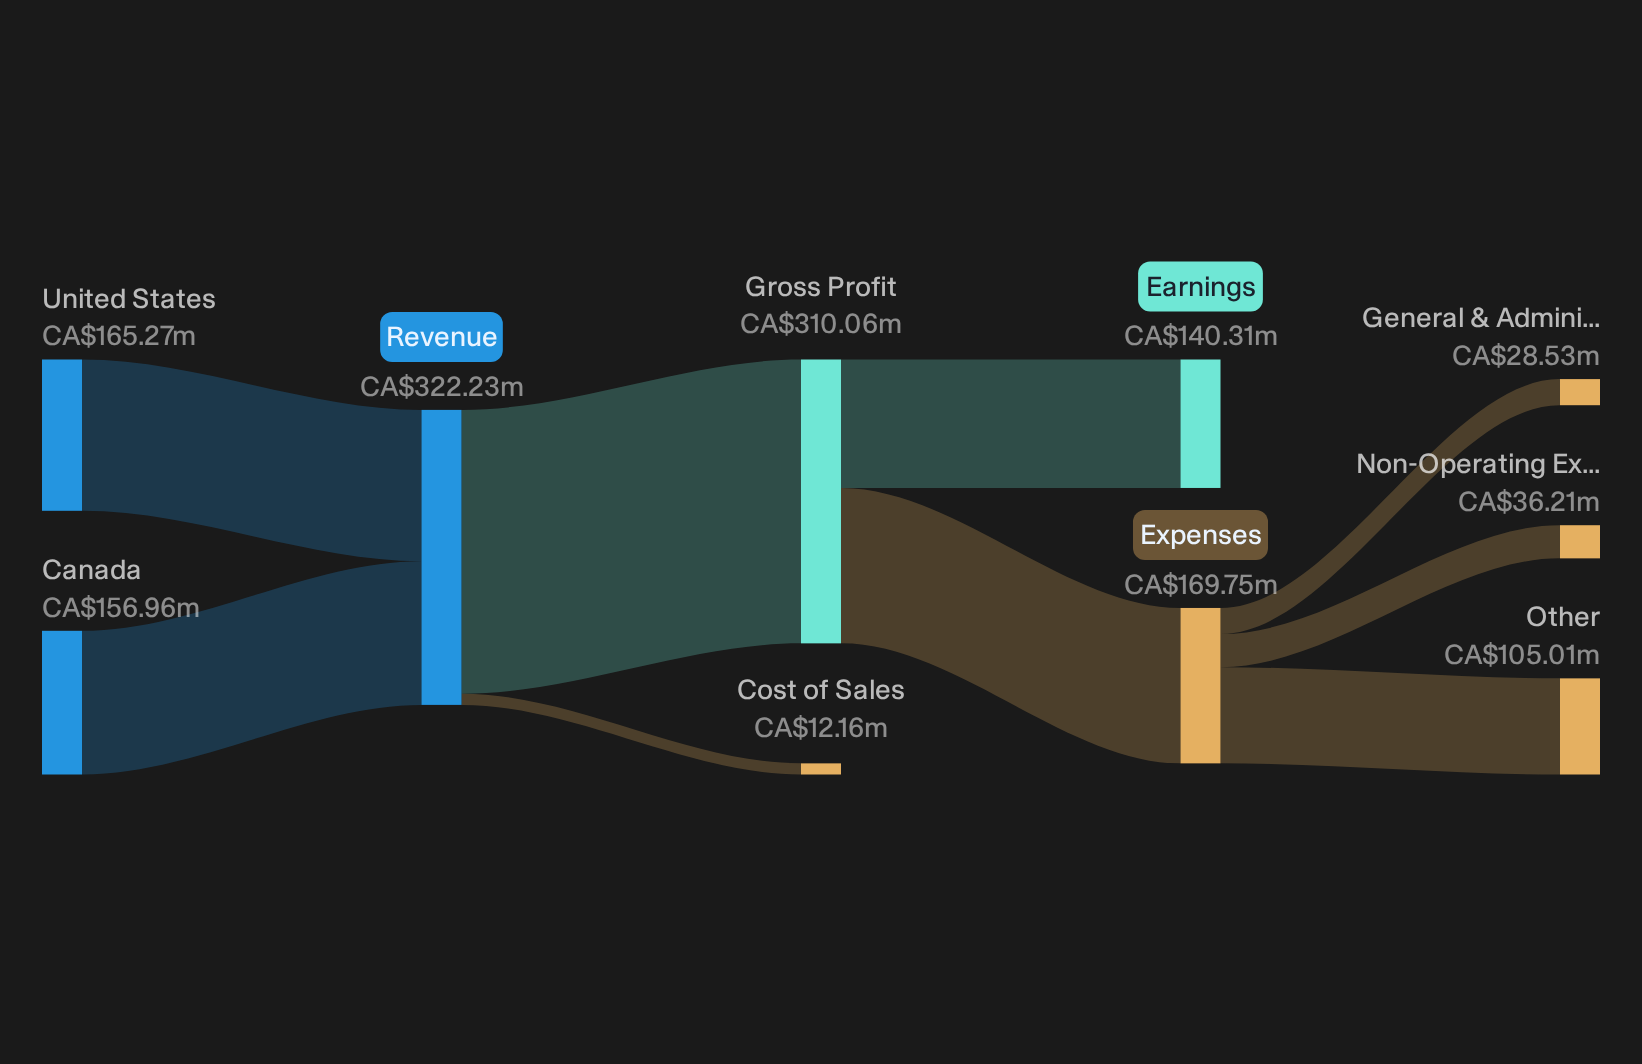
Overview: Freehold Royalties collects royalty income from oil, gas, NGL and potash production in Canada and the U.S., supporting a covered, income focused dividend profile.
Operations: Freehold Royalties generates about CA$322 million from oil and gas exploration and production royalties, roughly split between Canada and the United States.
Market Cap: CA$2.8 billion
Freehold Royalties matters for this Dividend Powerhouses screen because its royalty structure turns other operators’ production into relatively steady cash that funds a high yield without day to day operating costs eating into those distributions.
"This model is reflected in the financial statements as operational margins that are maintained even during periods of high inflation."
The key factor that will shape how secure those payouts feel in the coming years is how one quiet funding and payout tension is ultimately resolved.
That payout question is exactly what the full narrative for Freehold Royalties unpacks, revealing where Freehold Royalties’ cash engine might be quietly accelerating or masking emerging risks.
Curious About What You Might Be Missing?
Fresh opportunities often move from quiet to crowded fast. Screen for dividend power, momentum and resilience before the crowd catches on and while it matters. Get in early.
- Spot income workhorses with strong cash coverage, then use the curated 3 dividend fortresses to see which payouts still look built to handle market shocks.
- Track future tech leaders early by scanning the hand picked 4 AI small caps that pair real business models with AI products already gaining commercial traction.
- Lock onto sturdy balance sheets before momentum flies, filtering through the focused list of solid balance sheet and fundamentals (8 results) to find businesses where financial strength does the heavy lifting.
This article by Simply Wall St is general in nature. We provide commentary based on historical data and analyst forecasts only using an unbiased methodology and our articles are not intended to be financial advice. It does not constitute a recommendation to buy or sell any stock, and does not take account of your objectives, or your financial situation. We aim to bring you long-term focused analysis driven by fundamental data. Note that our analysis may not factor in the latest price-sensitive company announcements or qualitative material. Simply Wall St has no position in any stocks mentioned.
Have feedback on this article? Concerned about the content? Get in touch with us directly. Alternatively, email editorial-team@simplywallst.com