
Clarkson (LSE:CKN) Tracks Europe Asia Trade Shifts, Is The Premium Already Priced In?
Clarkson (LSE:CKN) is back in focus as investors weigh fresh trade friction between Brussels and Beijing, with shifting Asia to Europe shipping flows intersecting with the firm’s appointment of Niamh Staunton as incoming CFO and Executive Director.
The recent focus on Asia to Europe trade friction has landed on a stock that has already been moving, with Clarkson’s latest share price at £53.20 and a year to date share price return of 40.55%, alongside a 1 year total shareholder return of 57.12%, suggesting strong momentum building over both shorter and longer horizons.
Scan how markets are pricing similar trade sensitive shipping and transport plays by reviewing the 41 power grid technology and infrastructure stocks that may also be reacting to shifting Asia Europe flows and tariffs.
Clarkson now looks like a robust shipping and data franchise attached to some punchy recent gains. The next step is to test whether that quality and momentum are already fully reflected in the price.
Preferred P/E of 21x: Is it justified?
For a stock that has already climbed strongly, the valuation question around Clarkson now hinges on whether a 21x P/E multiple is doing too much of the heavy lifting.
The P/E ratio compares what investors are paying for each pound of current earnings. For a shipping and maritime services group like Clarkson, that figure reflects expectations for future profit growth, the perceived resilience of its fee streams, and the quality of its earnings profile.
Clarkson is flagged as expensive on several fronts. The 21x P/E sits well above the estimated fair P/E of 12.4x, a level our fair ratio work suggests the market could eventually lean toward if expectations cool. The same 21x multiple is also higher than the European shipping industry average of 16x and above a peer group average of 11.3x. This points to investors assigning Clarkson a clear premium for its mix of broking, financial, support, and research operations.
Explore the SWS fair ratio for Clarkson.Result: Price-to-earnings of 21x (OVERVALUED)
Still, any slowdown in annual revenue or net income growth, or a sharp reversal in broader shipping trade flows, could quickly challenge Clarkson’s premium P/E story.
Find out about the key risks to this Clarkson narrative.
Another view on Clarkson’s value
The P/E work paints Clarkson as expensive, yet the SWS DCF model points the other way. On that cash flow view, the shares at £53.20 sit about 27.3% below an estimated value of £73.20. This frames the recent rerating as a possible discount rather than froth.
That clash between earnings multiples and cash flow value raises a simple question for you as an investor: which lens deserves more weight when a high quality shipping and data franchise appears both pricey on P/E and undervalued on future cash flows?
Look into how the SWS DCF model arrives at its fair value.
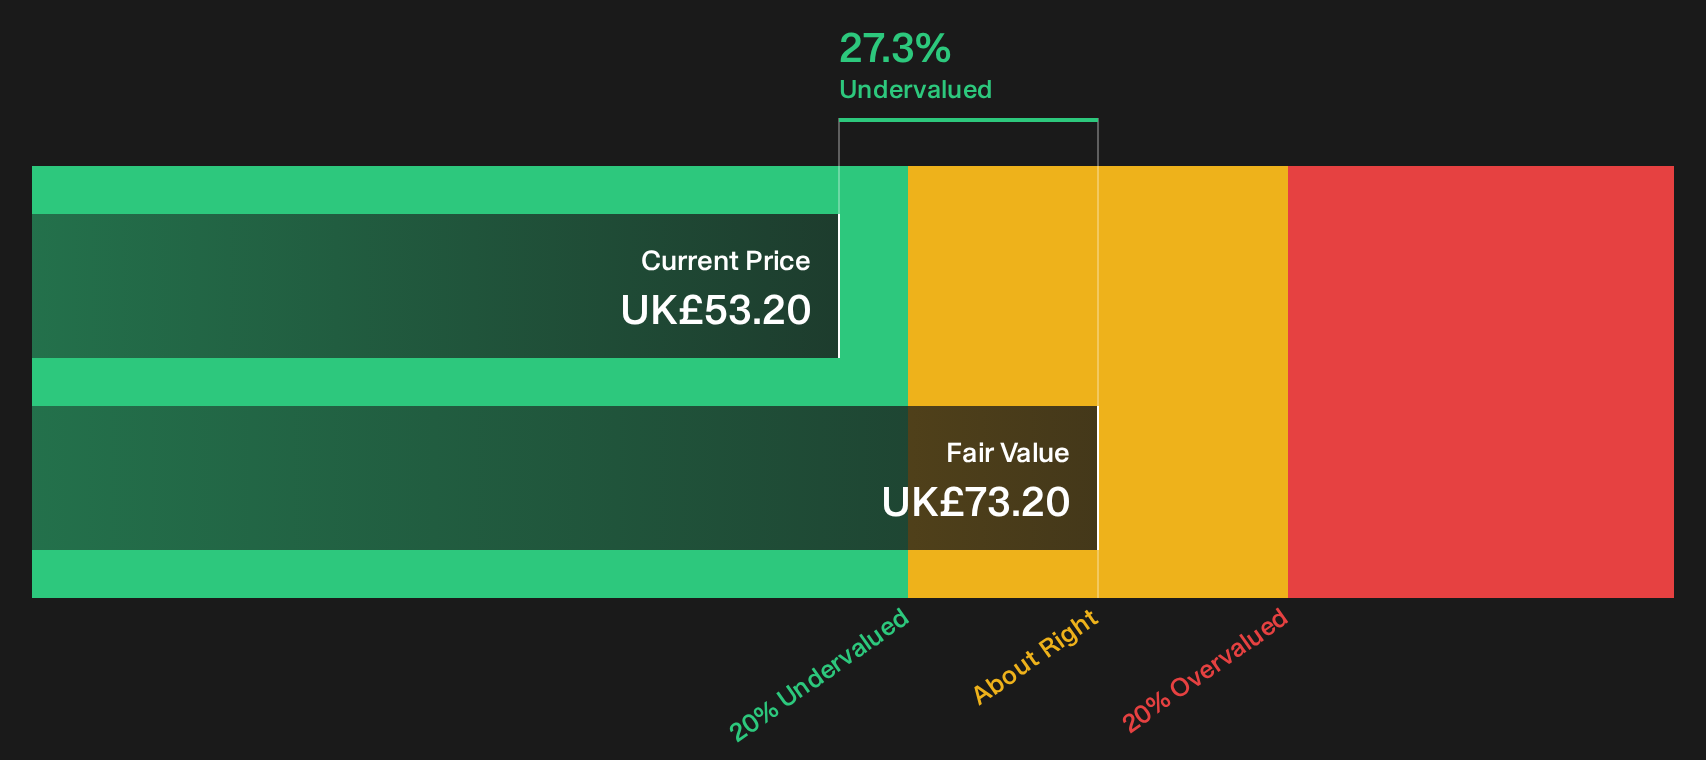
Simply Wall St performs a discounted cash flow (DCF) on every stock in the world every day (check out Clarkson for example). We show the entire calculation in full. You can track the result in your watchlist or portfolio and be alerted when this changes, or use our stock screener to discover 7 high quality undervalued stocks. If you save a screener we even alert you when new companies match - so you never miss a potential opportunity.
Next Steps
Momentum and valuation are pulling in different directions here, so move quickly to pull up the numbers for Clarkson, stress test your own thesis, and weigh those 3 key rewards.
Looking for more Clarkson investment ideas?
If Clarkson has sharpened your thinking, do not stop here. Broadening your watchlist with a few targeted angles can give you more context and better options.
- Target quality at a discount by scanning the 7 high quality undervalued stocks that combine strong fundamentals with room for sentiment to catch up.
- Strengthen your income stream by reviewing the 2 dividend fortresses that offer higher yields backed by sturdier balance sheets.
- Dial back portfolio stress by focusing on the 4 resilient stocks with low risk scores that score well on resilience when conditions turn choppy.
This article by Simply Wall St is general in nature. We provide commentary based on historical data and analyst forecasts only using an unbiased methodology and our articles are not intended to be financial advice. It does not constitute a recommendation to buy or sell any stock, and does not take account of your objectives, or your financial situation. We aim to bring you long-term focused analysis driven by fundamental data. Note that our analysis may not factor in the latest price-sensitive company announcements or qualitative material. Simply Wall St has no position in any stocks mentioned.
Have feedback on this article? Concerned about the content? Get in touch with us directly. Alternatively, email editorial-team@simplywallst.com