
J. M. Smucker (SJM), What Is Behind The Fresh Attention?
Recent Performance Puts J. M. Smucker in Focus
J. M. Smucker (SJM) has moved back onto investor watchlists after a period of positive share performance, with the stock up over the past week, month and past 3 months.
That recent momentum comes on top of a much stronger run over 2026. J. M. Smucker has posted a year to date share price return of 31.87% and a 1 year total shareholder return of 26.00%, which signals improving sentiment around both its earnings power and risk profile.
Compare J. M. Smucker’s momentum with a curated 33 high quality undervalued stocks that also combines solid cash flows with balance sheets investors often look for when sentiment starts to improve.
The share price has sprinted ahead while analyst targets and intrinsic value estimates still point higher. Does J. M. Smucker now trade near fair value, or is that gap sending a different signal?
Most Popular Narrative: 10.3% Undervalued
J. M. Smucker’s most followed valuation story pegs fair value at $142.13, above the recent $127.43 close. That gap is drawing fresh attention to how its brands, margins and balance sheet interact.
The main factor that has to go right is that J. M. Smucker converts momentum in core growth brands and ongoing cost discipline into sustained free cash flow around the current US$1.1 billion level while it continues to deleverage and manage the Hostess turnaround.
See why 16 investors see J. M. Smucker as 10% undervalued.
Result: Fair Value of $142.13 (UNDERVALUED)
Still, the narrative around J. M. Smucker can crack if FY27 net sales slip 1% to 2%, and if the Sweet Baked Snacks recovery continues to weigh on margins.
Find out about the key risks to this J. M. Smucker narrative.
Another View: What J. M. Smucker’s P/E Is Saying
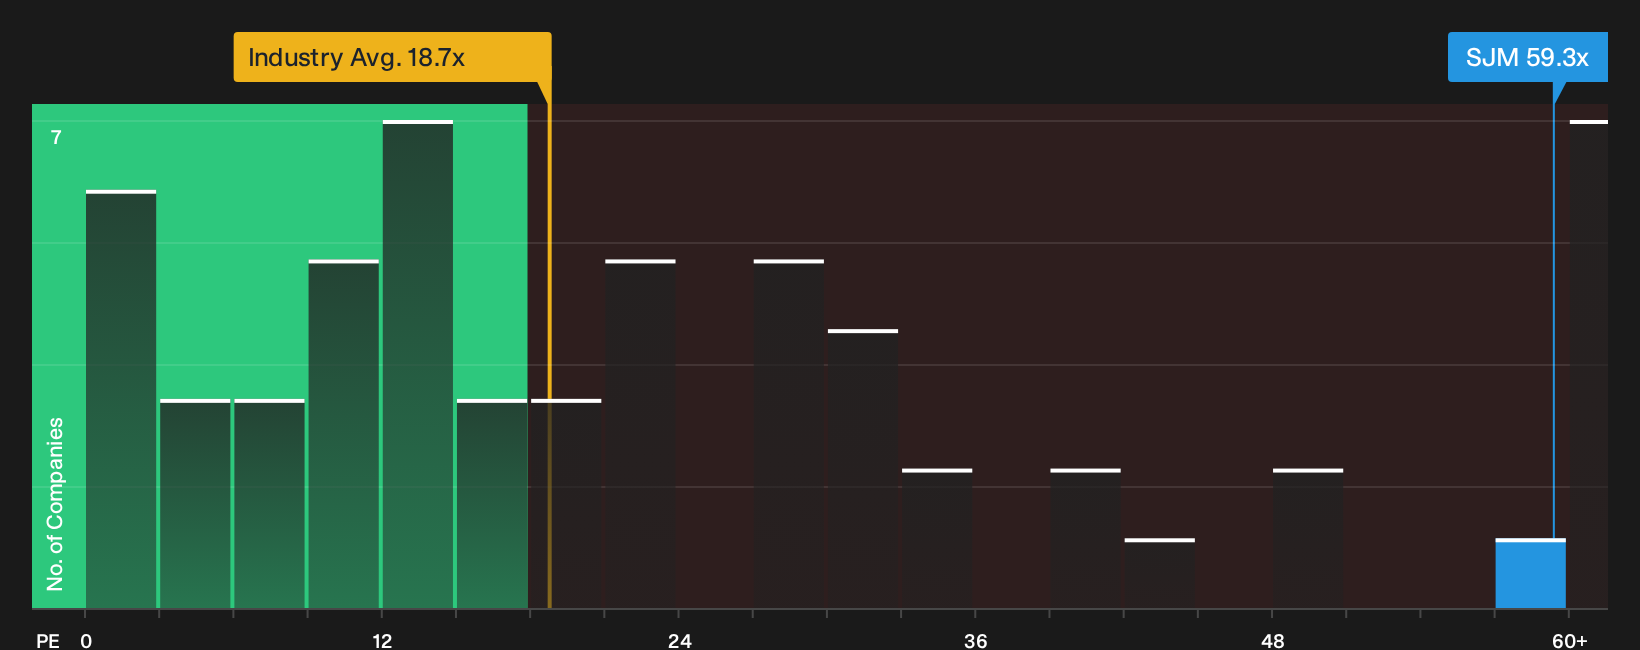
On the flip side of the fair value story sits the current earnings multiple. J. M. Smucker trades on a P/E of 59.3x, compared with 18.5x for the US Food industry and a fair ratio of 24.4x. This points to a rich tag that could compress if sentiment cools.
Those gaps against both peers and the fair ratio suggest limited room for further multiple expansion without stronger earnings delivery. It raises a simple question for investors following J. M. Smucker: is the recent enthusiasm already priced in or not yet fully tested by the next set of results?
See what the numbers say about this price — find out in our valuation breakdown.
Next Steps
Feeling torn between the upbeat tone around J. M. Smucker and the rich P/E backdrop? Act fast, review the data, and weigh both sides using the 3 key rewards and 3 important warning signs.
Looking for more J. M. Smucker investment ideas?
If J. M. Smucker has your attention, do not stop here. Use fresh screeners to surface other opportunities that fit your risk tolerance and return goals.
- Target dependable income streams by reviewing 8 dividend fortresses that could appeal if you prioritize regular cash returns from mature businesses.
- Hunt for quality at a discount through the 20 high quality undiscovered gems that highlight companies with strong fundamentals yet limited market attention.
- Prioritize resilience in choppier conditions by filtering for 32 resilient stocks with low risk scores that may suit investors wanting steadier profiles.
This article by Simply Wall St is general in nature. We provide commentary based on historical data and analyst forecasts only using an unbiased methodology and our articles are not intended to be financial advice. It does not constitute a recommendation to buy or sell any stock, and does not take account of your objectives, or your financial situation. We aim to bring you long-term focused analysis driven by fundamental data. Note that our analysis may not factor in the latest price-sensitive company announcements or qualitative material. Simply Wall St has no position in any stocks mentioned.
Have feedback on this article? Concerned about the content? Get in touch with us directly. Alternatively, email editorial-team@simplywallst.com