
Iyogin Holdings (TSE:5830) Completes Buyback, Is The Stock Fully Valued?
Iyogin Holdings (TSE:5830) has just wrapped up a share repurchase tranche, buying 2,787,800 shares, or 0.97% of its equity, for ¥10,871.56 million under the August 7, 2026 buyback plan.
Iyogin Holdings’ buyback comes amid a mixed price pattern, with the share price up 35.18% year to date and a 90 day share price return of 9.07%, even though the 30 day share price return declined 7.99%. At the same time, the 1 year total shareholder return of 71.80% and 5 year total shareholder return of about 7x suggest momentum has been building over time.
Scan how Iyogin Holdings compares with other financials returning capital to shareholders by reviewing our hand picked list of list of solid balance sheet and fundamentals (21 results).
Iyogin Holdings appears to be a solid regional banking group with a broad mix of services and a fresh buyback to match. The key question now is whether that quality is already reflected in the share price.
Price-to-Earnings of 13.6x: Is it justified?
On simple earnings terms, Iyogin Holdings trades on a P/E of 13.6x, which lines up closely with the broader Japan market while sitting below both its banking peers and an internally estimated fair level for the stock.
The P/E ratio compares the current share price to earnings per share. For a lender like Iyogin Holdings that already reports high quality earnings and a net profit margin of 34.8%, it provides a straightforward way to see how much investors are paying for each unit of current profit.
Earnings are forecast to grow 6.1% per year, which is slower than the 9.5% expected for the Japan market. That type of outlook can help explain why the P/E is not far above the wider market, even though the business has grown profits 27.8% per year over the past 5 years and lifted margins from 30.6%.
The valuation gap appears clearly when you compare Iyogin Holdings with its banking peers. The stock trades at 13.6x earnings against a JP Banks industry average of 14.4x and a peer average of 15x. This means investors are paying less for each yen of profit than they are for similar financial institutions. The estimated fair P/E of 15.1x is also higher than where the shares currently change hands, a level the market could approach if sentiment on the earnings profile remains supportive.
Explore the SWS fair ratio for Iyogin Holdings.
Result: Price-to-Earnings of 13.6x (UNDERVALUED)
Still, Iyogin Holdings depends heavily on a single market, with all reported revenue tied to Japan. Any shock to domestic credit conditions or regulation could hit earnings harder than it would for a more diversified lender.
Find out about the key risks to this Iyogin Holdings narrative.
Another View: DCF Puts Iyogin Holdings On The Expensive Side
The P/E ratio presents Iyogin Holdings as inexpensive compared with peers, but the SWS DCF model indicates a different picture. On a cash flow basis, an estimated value of around ¥2,987 per share sits below the current ¥3,522 price, which suggests Iyogin Holdings appears overvalued on this metric.
For investors, that difference indicates less room for error if earnings or credit conditions soften. The question is whether you are comfortable paying above our DCF estimate for a bank with forecast profit growth of 6.1% a year.
Look into how the SWS DCF model arrives at its fair value.
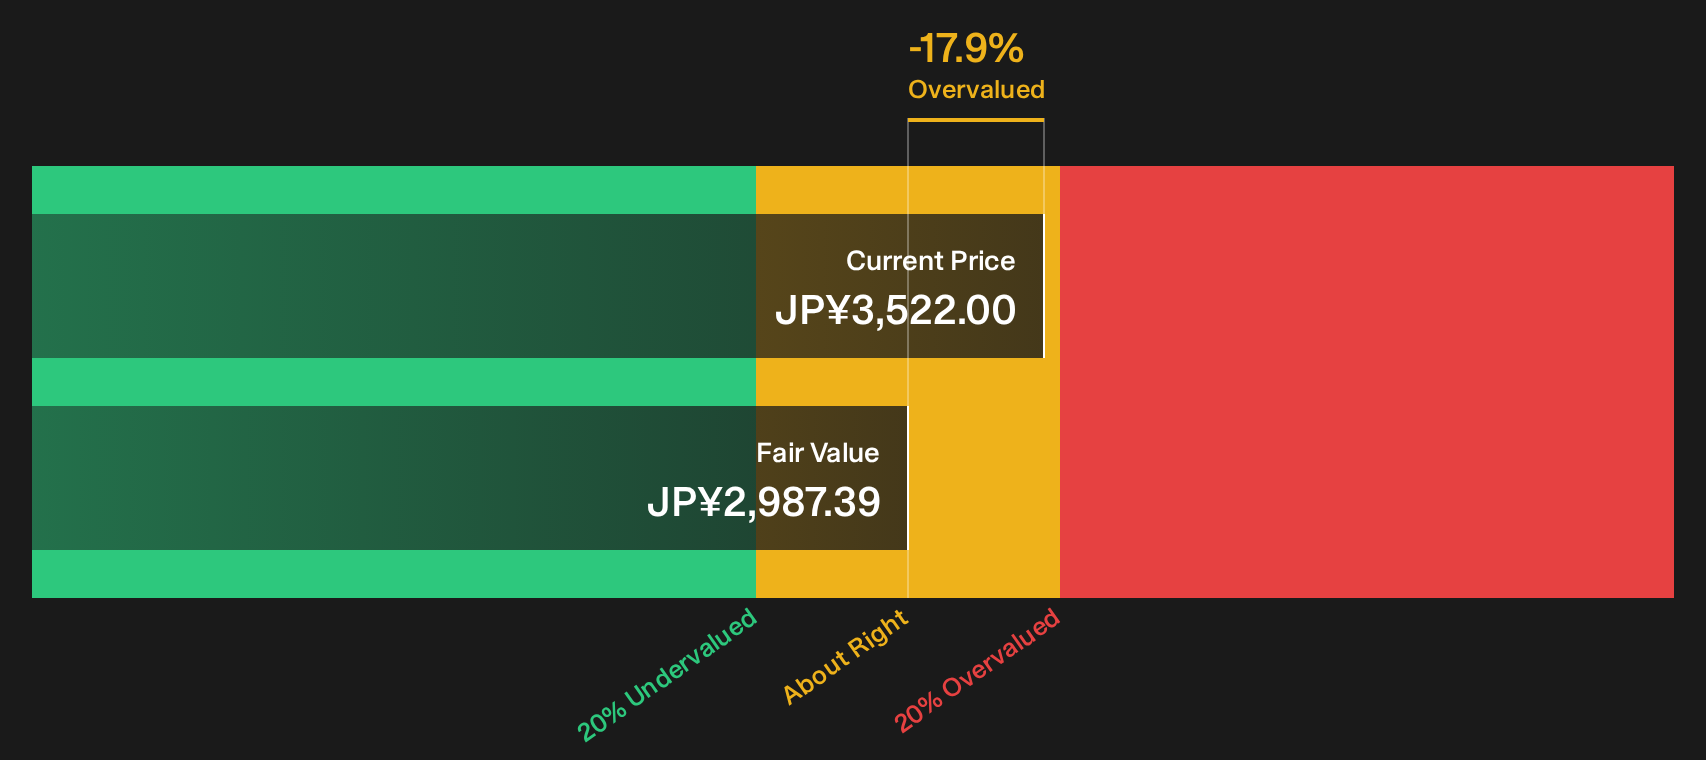
Simply Wall St performs a discounted cash flow (DCF) on every stock in the world every day (check out Iyogin Holdings for example). We show the entire calculation in full. You can track the result in your watchlist or portfolio and be alerted when this changes, or use our stock screener to discover 14 high quality undervalued stocks. If you save a screener we even alert you when new companies match - so you never miss a potential opportunity.
Next Steps
If Iyogin Holdings looks pulled between attractive valuation signals and a cautious DCF, that tension is exactly what you want to test for yourself in the numbers. To weigh those cross currents properly, start by reviewing the 5 key rewards and 1 important warning sign.
Looking for more Iyogin Holdings style ideas?
If Iyogin Holdings has sharpened your focus on quality and price, do not stop here. Broader idea sourcing can help you build a stronger portfolio.
- Target dependable payers that prioritise income strength by reviewing our hand picked list of 29 dividend fortresses.
- Hunt for quality at a sensible price by scanning companies on our curated 14 high quality undervalued stocks.
- Prioritise resilience and capital protection by reviewing stocks in the carefully filtered 22 resilient stocks with low risk scores.
This article by Simply Wall St is general in nature. We provide commentary based on historical data and analyst forecasts only using an unbiased methodology and our articles are not intended to be financial advice. It does not constitute a recommendation to buy or sell any stock, and does not take account of your objectives, or your financial situation. We aim to bring you long-term focused analysis driven by fundamental data. Note that our analysis may not factor in the latest price-sensitive company announcements or qualitative material. Simply Wall St has no position in any stocks mentioned.
Have feedback on this article? Concerned about the content? Get in touch with us directly. Alternatively, email editorial-team@simplywallst.com