
Moonpig Group (LSE:MOON) Climbed, So What Is Drawing Fresh Attention?
Fresh interest in Moonpig Group (LSE:MOON) has been sparked by new analysis suggesting its strong cash generation is not fully reflected in the current share price, putting intrinsic value and expectations under the spotlight.
Momentum around Moonpig Group has been building, with the share price delivering a 14.54% 1-month share price return and a 48.16% year-to-date share price return, alongside a 40.60% 1-year total shareholder return and a 102.29% 3-year total shareholder return. This helps explain why fresh scrutiny of its cash flow and valuation is intensifying at a £2.978 share price.
Compare Moonpig Group's cash flow story with other potential opportunities by scanning our hand picked list of 7 high quality undervalued stocks.
After a run like Moonpig Group has just delivered, the real tension is simple. Does the current £2.978 price still leave enough upside in the cash flow story to justify taking on fresh risk?
Preferred P/E of 17x: Is it justified?
Moonpig Group now trades on a P/E of roughly 17x at a £2.978 share price, while the SWS DCF model suggests a future cash flow value of about £4.14 per share. This implies the market price is below that cash flow estimate even as earnings are priced more expensively than several benchmarks.
The P/E ratio compares what you pay per share with the profits that Moonpig Group generates per share, so a higher figure often means investors are willing to pay more today for each pound of earnings. For an online cards and gifting platform with £372.973m in revenue and £51.718m in net income, that multiple links directly to expectations around the durability of its profitability and the pace of future earnings growth.
Moonpig Group’s current P/E of 17x sits above the UK Specialty Retail industry average of 14x and above the peer average of 13x. This indicates the market is assigning a richer price to its earnings than many comparables. The estimated fair P/E from the Simply Wall St fair ratio work is 11.9x, a level the valuation could move towards if enthusiasm cools and investors decide to align the share more closely with that benchmark.
Explore the SWS fair ratio for Moonpig Group.
Result: Price-to-earnings of 17x (OVERVALUED)
Still, Moonpig Group’s premium P/E could come under pressure if revenue growth around its £372.973m top line slows, or if profit expansion stalls.
Find out about the key risks to this Moonpig Group narrative.
Another view on Moonpig Group’s value
The P/E verdict paints Moonpig Group as expensive, yet the SWS DCF model points in the opposite direction, with a future cash flow value of about £4.14 per share versus a £2.978 market price. That gap suggests investors are paying up on earnings while still underpaying on long term cash generation. Which signal do you trust more?
Look into how the SWS DCF model arrives at its fair value.
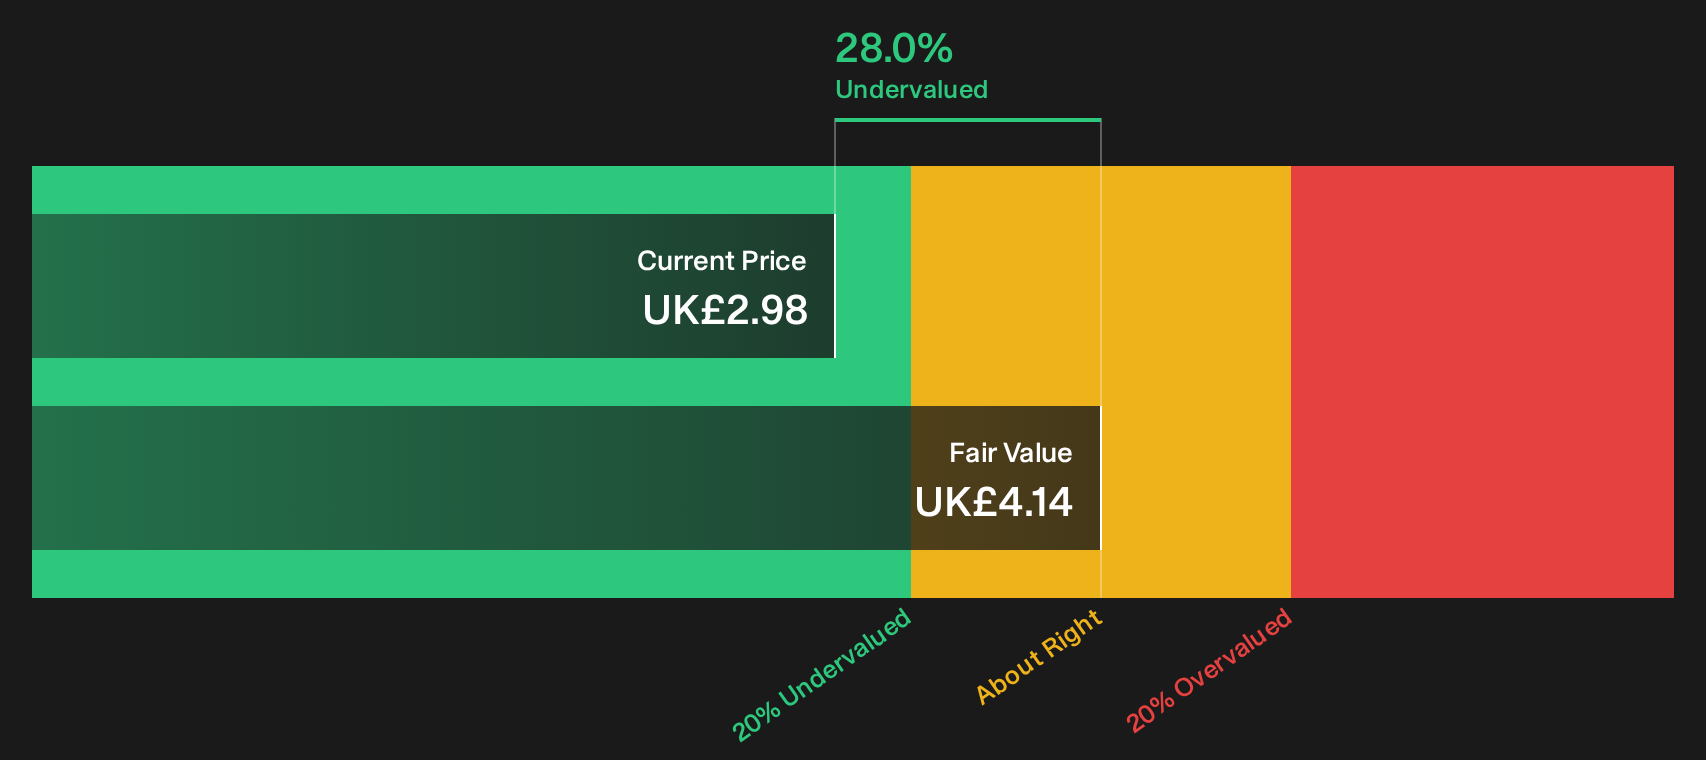
Simply Wall St performs a discounted cash flow (DCF) on every stock in the world every day (check out Moonpig Group for example). We show the entire calculation in full. You can track the result in your watchlist or portfolio and be alerted when this changes, or use our stock screener to discover 7 high quality undervalued stocks. If you save a screener we even alert you when new companies match - so you never miss a potential opportunity.
Next Steps
Mixed signals around Moonpig Group are clear. Treat this as your cue to move quickly, review the data, and weigh both sides of the story by checking the 3 key rewards and 3 important warning signs.
Looking for more Moonpig Group sized investment ideas?
If you stop with Moonpig Group, you risk missing other setups that fit your style. Put a few minutes into a quick screen now and future you will be glad you did.
- Hunt for strong businesses trading at appealing valuations by running a focused search through our 7 high quality undervalued stocks.
- Build a steadier income stream by scanning companies that feature in our 2 dividend fortresses.
- Reduce portfolio stress by filtering for firms in the 4 resilient stocks with low risk scores.
This article by Simply Wall St is general in nature. We provide commentary based on historical data and analyst forecasts only using an unbiased methodology and our articles are not intended to be financial advice. It does not constitute a recommendation to buy or sell any stock, and does not take account of your objectives, or your financial situation. We aim to bring you long-term focused analysis driven by fundamental data. Note that our analysis may not factor in the latest price-sensitive company announcements or qualitative material. Simply Wall St has no position in any stocks mentioned.
Have feedback on this article? Concerned about the content? Get in touch with us directly. Alternatively, email editorial-team@simplywallst.com