
Nippon Electric Glass (TSE:5214) Unveils BDX 3 As Investors Ask If The Stock Is A Bargain
Nippon Electric Glass (TSE:5214) has picked up fresh attention after unveiling BDX-3, an ultra-thin Starveil cover glass aimed at improving radiation and UV protection for satellites across multiple orbital zones.
Despite the BDX-3 launch grabbing headlines, Nippon Electric Glass shares trade at ¥5,010 after a mixed year, where the 1-year total shareholder return of 6.3% contrasts with a year-to-date share price decline of 19.5%. At the same time, a 3-year total shareholder return of about 100% hints that long-term momentum has been much stronger than recent sentiment.
Scan beyond Nippon Electric Glass and see how other specialty material and tech suppliers with potential valuation support line up in our curated list of 13 high quality undervalued stocks.
Nippon Electric Glass trades about 8% below analyst targets after a sharp year-to-date slide. Is that a margin of safety, or a warning that caution around this stock still has further to run?
Preferred P/E of 14.2x: Is it justified for Nippon Electric Glass?
Nippon Electric Glass changes hands at a P/E of 14.2x, which lines up below both its industry and peer averages and points to a market that is pricing the stock more cautiously than many electronic sector rivals.
The P/E ratio compares the current share price to earnings per share and reflects what investors are willing to pay for each unit of profit. For a specialist glass producer tied to display, semiconductor and industrial demand cycles, earnings can move with end markets, so the multiple often becomes a shorthand for how much confidence investors have in the durability of those profits.
Forecasts point to earnings growth of 5.57% per year, alongside revenue growth of 2.5% per year that trails the broader JP market, and a return on equity that is expected to stay low at 5.3% to 5.4%. That mix suggests the market might be applying a restrained valuation because profitability metrics and growth expectations are not especially aggressive, even though earnings are expected to improve rather than shrink.
The discount becomes clearer in context. Nippon Electric Glass trades on a 14.2x P/E compared to the JP Electronic industry average of 15.9x and a peer average of 25.1x, and the estimated fair P/E ratio sits higher again at 17.1x. The current valuation is therefore meaningfully lower than both sector benchmarks and the level the market could move towards if sentiment aligned with that fair ratio estimate.
Explore the SWS fair ratio for Nippon Electric Glass.
Result: Price-to-Earnings of 14.2x (UNDERVALUED).
Still, a further slide in Nippon Electric Glass year to date, along with a relatively low expected return on equity, could signal that weaker sentiment has not fully played out.
Find out about the key risks to this Nippon Electric Glass narrative.
Another view on Nippon Electric Glass valuation
The SWS DCF model lands in a very different place. Nippon Electric Glass trades at ¥5,010, while the model’s estimate of future cash flow value is ¥1,852.08. That points to an overvalued stock on this method, which raises a simple question for you: Which signal do you trust more, earnings multiples or cash flows?
Look into how the SWS DCF model arrives at its fair value.
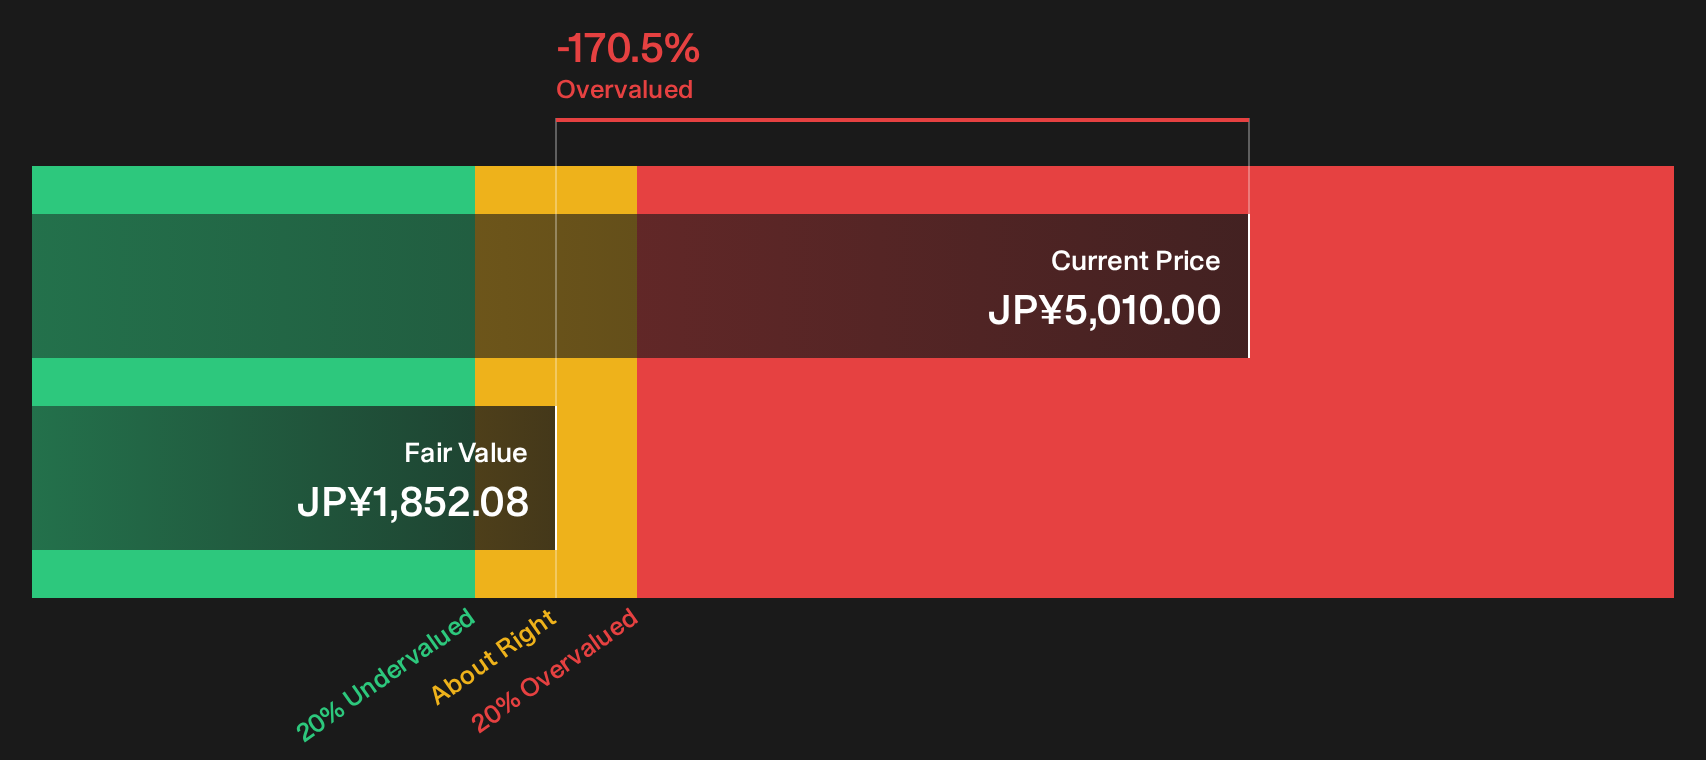
Simply Wall St performs a discounted cash flow (DCF) on every stock in the world every day (check out Nippon Electric Glass for example). We show the entire calculation in full. You can track the result in your watchlist or portfolio and be alerted when this changes, or use our stock screener to discover 13 high quality undervalued stocks. If you save a screener we even alert you when new companies match - so you never miss a potential opportunity.
Next Steps
If this mix of signals around Nippon Electric Glass leaves you unsure, act promptly. Check the underlying data, and weigh both sides of the story by reviewing the 4 key rewards and 2 important warning signs.
Looking for more investment ideas beyond Nippon Electric Glass?
Do not stop with Nippon Electric Glass. Use this analysis as a springboard and let a wider watchlist sharpen your sense of risk, reward and timing.
- Prioritise resilience by scanning companies that pair strong finances with healthy cash positions through a focused list of solid balance sheet and fundamentals (22 results).
- Hunt for potential mispricing by reviewing a curated 13 high quality undervalued stocks that filters for quality as well as price.
- Strengthen income potential by zeroing in on a targeted 29 dividend fortresses that screens for higher yields with more robust profiles.
This article by Simply Wall St is general in nature. We provide commentary based on historical data and analyst forecasts only using an unbiased methodology and our articles are not intended to be financial advice. It does not constitute a recommendation to buy or sell any stock, and does not take account of your objectives, or your financial situation. We aim to bring you long-term focused analysis driven by fundamental data. Note that our analysis may not factor in the latest price-sensitive company announcements or qualitative material. Simply Wall St has no position in any stocks mentioned.
Have feedback on this article? Concerned about the content? Get in touch with us directly. Alternatively, email editorial-team@simplywallst.com