
Kinder Morgan (KMI) Advances Project Backlog, Is It Fully Valued?
Kinder Morgan (KMI) is back in focus after its Louisiana pipeline unit filed a fresh construction status report with US regulators for the Texas Header Project, highlighting steady progress on helical pile and platform installation.
Recent price action shows that Kinder Morgan’s 4.2% 1 day share price return and 7.4% 30 day share price return have come on top of a 23.4% year to date share price gain. In addition, the 5 year total shareholder return of 153.6% points to momentum that has been building over a longer horizon.
Spot similar infrastructure driven stories by scanning our hand picked 42 power grid technology and infrastructure stocks, which could benefit as energy transport and grid investment stay in focus.After Kinder Morgan’s run and the progress on projects like Texas Header, optimists see a durable cash engine, while sceptics focus on how much of that story is already in the price. Which side does the valuation work support next?
Most Popular Narrative: 4.7% Undervalued
Kinder Morgan last closed at $34.20, while the most followed narrative pegs fair value at $35.90 using a 7.2% discount rate. That gap is small in price terms, yet the thesis behind it leans heavily on how much of the growth backlog turns into long term cash flow.
The current roughly $9.6b Board approved growth backlog, which is mainly tied to take or pay natural gas projects with an average in service date in the first half of 2028, is expected by management to translate into about $1.7b of incremental EBITDA over time, which could lift Kinder Morgan's future cash generation as these assets move from construction to operation.
See why 74 investors see Kinder Morgan as 5% undervalued.
Result: Fair Value of $35.90 (UNDERVALUED)
Still, the Kinder Morgan story can shift quickly if major projects stall at the permitting or contracting stage or if heavier spending pushes leverage toward the top of management’s target range.
Find out about the key risks to this Kinder Morgan narrative.
Another View On Kinder Morgan’s Valuation
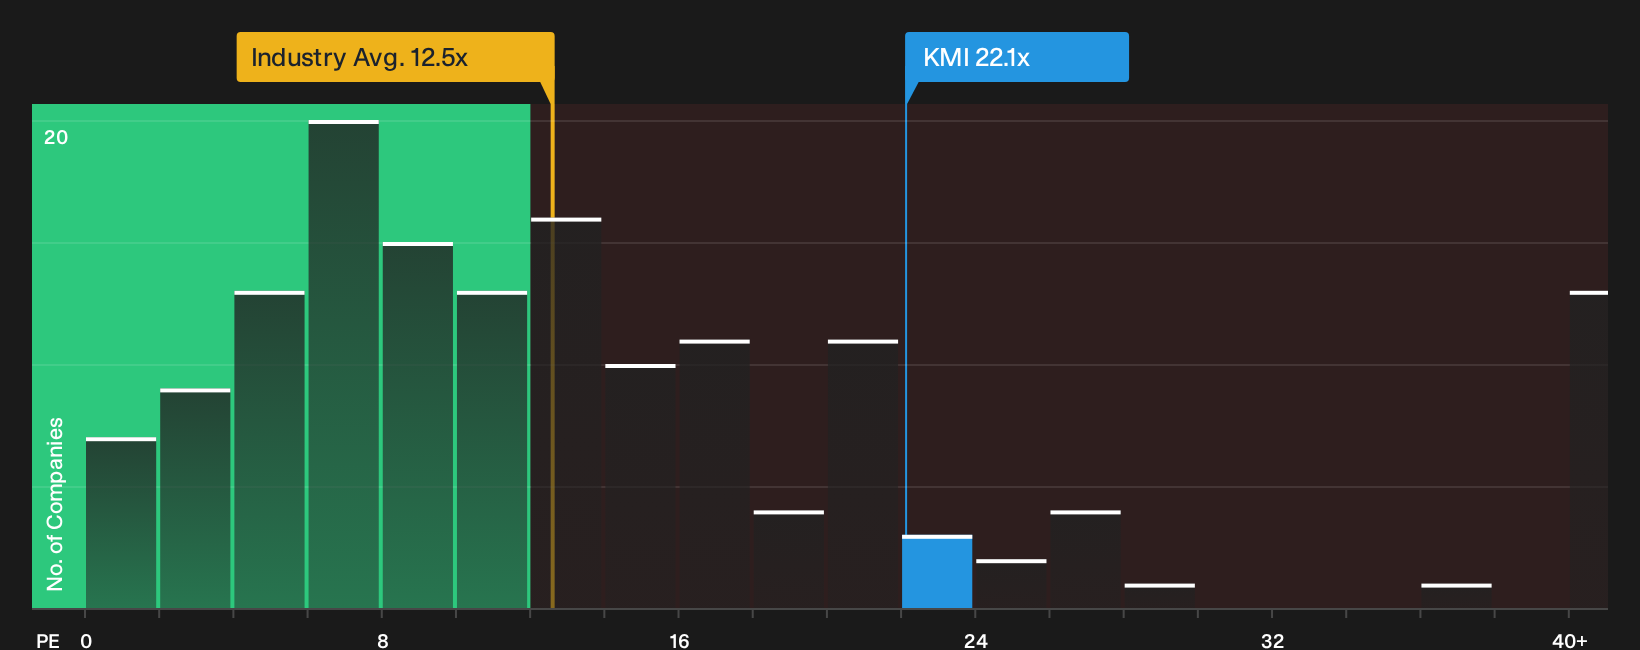
The narrative fair value for Kinder Morgan points to a 4.7% undervaluation, yet the P/E picture tells a different story. At 22.1x earnings against a fair ratio of 20.1x, and compared with 12.5x for the US Oil and Gas industry and 20.8x for peers, the stock looks expensive on earnings. Is that premium a cushion of safety for contracted cash flows, or a valuation risk if growth underdelivers?
For investors weighing the earnings multiple against the DCF argument, the next step is to stress test which scenario feels more realistic before leaning on either signal. See what the numbers say about this price — find out in our valuation breakdown.
Next Steps
Mixed signals on Kinder Morgan so far. Take a closer look at the data, weigh the trade offs yourself, and then drill into the 3 key rewards and 2 important warning signs
Looking For More Investment Ideas Beyond Kinder Morgan?
If Kinder Morgan has sharpened your focus on where capital can work harder, do not stop here. Use the Simply Wall Street Screener to quickly surface fresh opportunities matched to your style.
- Target strong fundamentals and pricing power by scanning a curated set of 33 high quality undervalued stocks before the rest of the market catches on.
- Prioritise resilience by reviewing a 32 resilient stocks with low risk scores that aims to reduce portfolio volatility without walking away from potential upside.
- Hunt for under-the-radar potential by checking a 20 high quality undiscovered gems that most investors are not watching yet.
This article by Simply Wall St is general in nature. We provide commentary based on historical data and analyst forecasts only using an unbiased methodology and our articles are not intended to be financial advice. It does not constitute a recommendation to buy or sell any stock, and does not take account of your objectives, or your financial situation. We aim to bring you long-term focused analysis driven by fundamental data. Note that our analysis may not factor in the latest price-sensitive company announcements or qualitative material. Simply Wall St has no position in any stocks mentioned.
Have feedback on this article? Concerned about the content? Get in touch with us directly. Alternatively, email editorial-team@simplywallst.com