
What Is Going On With Lennar (LEN)?
Lennar (LEN) just broke ground on The Foundry in downtown Las Vegas, a community with more than 1,000 homes, while also expanding in Alabama and advancing a mixed-use project called Broadcast District.
These new communities and the recent fixed income offerings are landing at a time when Lennar’s short-term share price performance has been relatively soft. The 90-day share price return is down 7.02% and the year-to-date share price return is down 26.04%, while the 1-year total shareholder return has declined 37.36%, suggesting recent headlines have not yet shifted broader sentiment.
Spot opportunities beyond Lennar by scanning a hand picked 33 high quality undervalued stocks that combines expansion potential with balance sheet strength.For Lennar, fresh projects and new debt sit beside a share price that has already fallen hard. Is the recent slide an early entry point, or a sign that most of the easy upside is already gone given the current valuation?
Most Popular Narrative: 1% Undervalued
Lennar is trading at $77.08 compared with a narrative fair value of $77.87, so the current price roughly lines up with that framework while still reflecting a slight discount. For anyone tracking the recent share price pullback, the key question is whether the business model and future assumptions used in that narrative still feel reasonable.
The company's focus on driving consistent volume and production efficiency by matching production pace with sales pace is now supported by record construction cycle times of 116 days and tighter completed inventory. This can affect future gross margin and returns on inventory.
See why 45 investors see Lennar as 1% undervalued.
Result: Fair Value of $77.87 (ABOUT RIGHT)
Still, the Lennar story can break if affordability weakens further or if higher land and option costs squeeze the already pressured margin profile.
Find out about the key risks to this Lennar narrative.
Another View: Lennar Through The P/E Lens
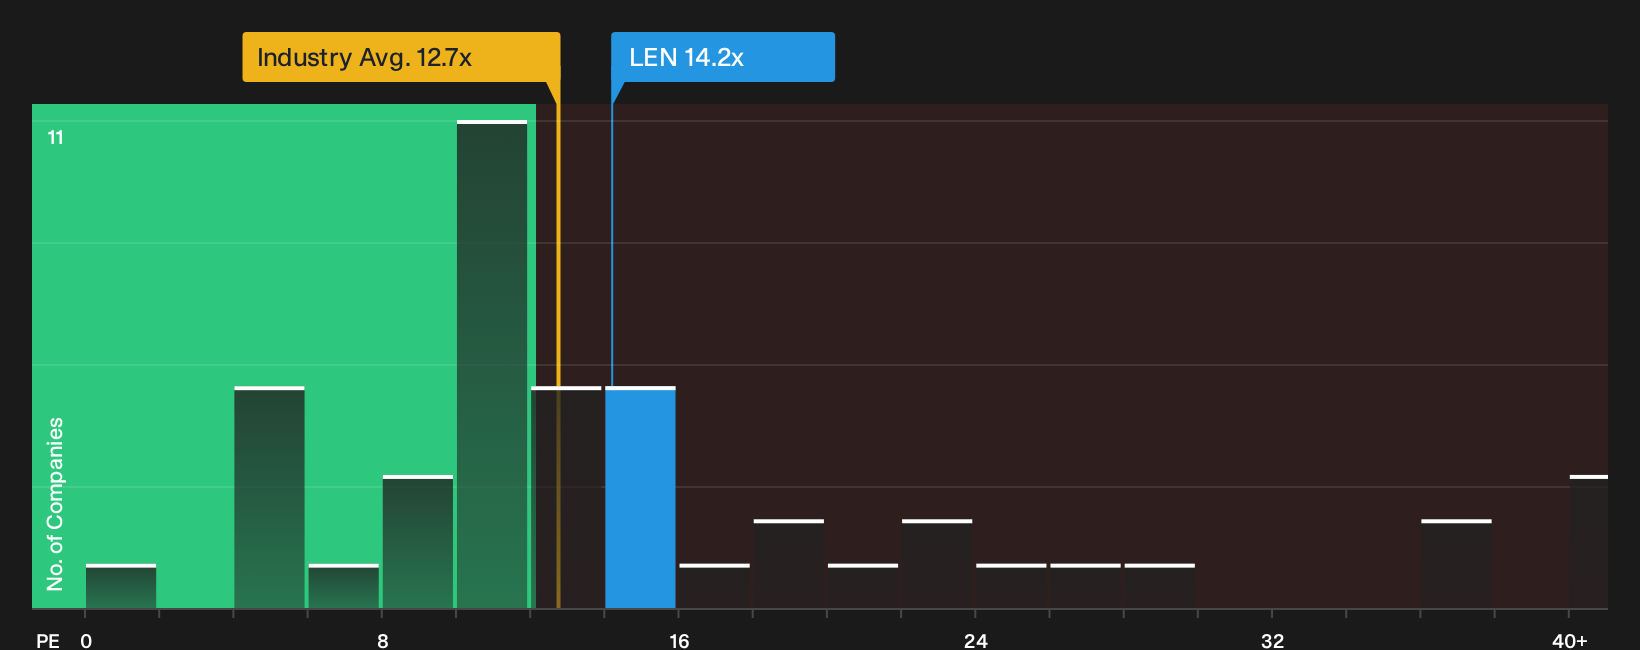
The first narrative says Lennar looks roughly fairly priced around $77 based on future earnings estimates and discounted cash flows. A simple P/E check tells a different story. Lennar trades on 14.2x earnings. The wider US Consumer Durables group sits at 12.7x, and close peers average 12x.
The fair ratio for Lennar is calculated at 21.6x, well above all of those numbers. That gap suggests investors are already paying more than sector and peer averages but less than what the fair ratio implies the market could move toward. Is that a margin of safety or a valuation trap if sentiment stays weak?
Before leaning too heavily on any single earnings multiple, it can help to see how the rest of the numbers stack up in a full valuation breakdown, including cash flows, balance sheet, and forecast returns. See what the numbers say about this price — find out in our valuation breakdown.
Next Steps
Mixed signals around Lennar can leave you stuck on the fence, so move quickly, stress test the assumptions, and weigh both sides through the 3 key rewards and 1 important warning sign.
Looking for more investment ideas beyond Lennar?
Do not wait for the next headline to tell you where to look. Use the Simply Wall Street Screener now to line up fresh opportunities on your own terms.
- Target potential mispricings by scanning a curated 33 high quality undervalued stocks that blends earnings power with balance sheet resilience.
- Prioritise staying power with a list of solid balance sheet and fundamentals (25 results) that filters for companies carrying less financial strain and stronger funding flexibility.
- Hunt for early-stage opportunities through a 20 high quality undiscovered gems that highlights quality businesses still flying under most investors' radar.
This article by Simply Wall St is general in nature. We provide commentary based on historical data and analyst forecasts only using an unbiased methodology and our articles are not intended to be financial advice. It does not constitute a recommendation to buy or sell any stock, and does not take account of your objectives, or your financial situation. We aim to bring you long-term focused analysis driven by fundamental data. Note that our analysis may not factor in the latest price-sensitive company announcements or qualitative material. Simply Wall St has no position in any stocks mentioned.
Have feedback on this article? Concerned about the content? Get in touch with us directly. Alternatively, email editorial-team@simplywallst.com