
Mivtach Shamir Holdings (TASE:MISH) Rallies As Premium Valuation Comes Under Scrutiny
Recent commentary on Mivtach Shamir Holdings (TASE:MISH) focuses on its elevated P/S ratio compared with industry peers, following a strong multi year share price run that has put the spotlight on whether current revenue and assets justify that premium.
Mivtach Shamir Holdings has seen short term momentum pick up again, with a 1 day share price return of 4.6% and a 7 day share price return of 4.1%. This comes even though the 90 day share price return is down about 10% and the year to date share price return is down about 7%, while the 1 year total shareholder return of 36% and 3 year total shareholder return of a little over 4x keep the spotlight on whether the current ₪398.1 price and elevated P/S ratio still line up with the underlying portfolio and revenue base.
Compare Mivtach Shamir Holdings to a curated 189 high quality undervalued stocks that aligns premium valuations with stronger fundamentals and potentially steadier expectations.
Mivtach Shamir Holdings trades at a premium P/S ratio while its intrinsic value model flags a large discount. Is the market being too cautious, or simply realistic about the volatility in this investment portfolio?
Preferred Price-to-Sales of 6.8x: Is it justified?
Mivtach Shamir Holdings screens as expensive on a pure revenue lens, with a P/S ratio of 6.8x against the last close of ₪398.1, while peers in the Asian Diversified Financial industry cluster much lower.
The P/S metric compares the market value of the equity to the trailing revenue base. A higher number signals investors are willing to pay more for each ₪1 of sales. For a holding vehicle and investment firm like Mivtach Shamir Holdings, that often reflects expectations around the quality of the underlying portfolio, realizations from exits, and the perceived repeatability of fee and financing income.
In this case, the gap is wide. The stock trades on 6.8x revenue compared with a peer average of 1.5x and an industry average of 3.7x. That implies the market is assigning a substantial premium to this set of assets and earnings power, despite recent pressure on profitability, a current net margin of 2.8% that is well below last year’s 18.4%, and an intrinsic value model that places future cash flow value around ₪138.66 per share.
See what the numbers say about this price — find out in our valuation breakdown.
Result: Price-to-Sales of 6.8x (OVERVALUED)
Still, the wide gap between the intrinsic value estimate and the ₪398.1 share price, together with a recent 90 day pullback, could quickly challenge confidence in Mivtach Shamir Holdings.
Find out about the key risks to this Mivtach Shamir Holdings narrative.
Another View on Mivtach Shamir Holdings: What the DCF Says
The P/S discussion presents Mivtach Shamir Holdings as expensive, yet the SWS DCF model suggests a different perspective. With an estimated future cash flow value of ₪138.66 per share compared to the current ₪398.1 price, the framework indicates a wide valuation gap. Which lens do you rely on when cash flows and sentiment differ this sharply?
Look into how the SWS DCF model arrives at its fair value.
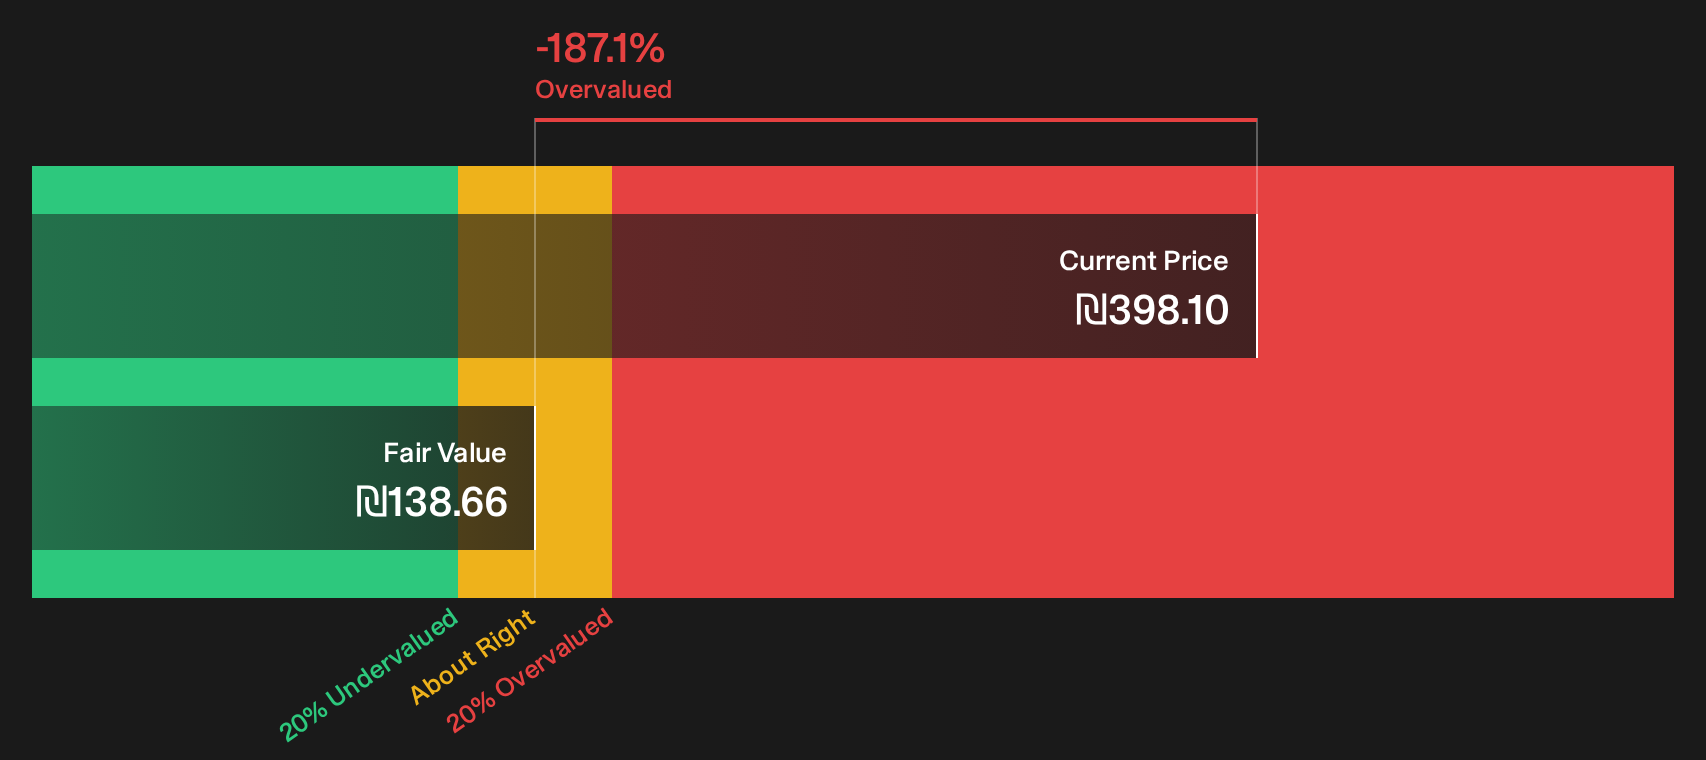
Simply Wall St performs a discounted cash flow (DCF) on every stock in the world every day (check out Mivtach Shamir Holdings for example). We show the entire calculation in full. You can track the result in your watchlist or portfolio and be alerted when this changes, or use our stock screener to discover 189 high quality undervalued stocks. If you save a screener we even alert you when new companies match - so you never miss a potential opportunity.
Next Steps
If this mix of premium pricing and discounted intrinsic estimates for Mivtach Shamir Holdings feels conflicted, treat it as a prompt to review the underlying figures yourself, weigh the probabilities that matter most to you, and then factor in the 4 important warning signs.
Looking for more investment ideas beyond Mivtach Shamir Holdings?
If Mivtach Shamir Holdings raises more questions than answers for your portfolio, broaden your search with other opportunities that better match your risk and return preferences.
- Target potential mispricings by scanning a 189 high quality undervalued stocks that filters for stronger fundamentals and cleaner balance sheets than many headline names.
- Prioritize resilience by checking a 232 resilient stocks with low risk scores that highlights companies with steadier historic volatility and more robust financial profiles.
- Hunt for future leaders by reviewing a 614 high quality undiscovered gems that focuses on smaller businesses with solid underlying numbers but limited market attention so far.
This article by Simply Wall St is general in nature. We provide commentary based on historical data and analyst forecasts only using an unbiased methodology and our articles are not intended to be financial advice. It does not constitute a recommendation to buy or sell any stock, and does not take account of your objectives, or your financial situation. We aim to bring you long-term focused analysis driven by fundamental data. Note that our analysis may not factor in the latest price-sensitive company announcements or qualitative material. Simply Wall St has no position in any stocks mentioned.
Have feedback on this article? Concerned about the content? Get in touch with us directly. Alternatively, email editorial-team@simplywallst.com