
3 Asian Stocks Estimated To Be Trading Below Intrinsic Value By Up To 49.8%
In recent months, Asian markets have experienced heightened volatility, driven by global concerns over AI spending and inflation pressures. Amid this uncertainty, investors are increasingly turning their attention to value-oriented opportunities, seeking stocks that may be trading below their intrinsic value. Identifying such stocks requires a keen focus on fundamentals and market conditions that suggest potential for growth relative to current valuations.
Top 10 Undervalued Stocks Based On Cash Flows In Asia
| Name | Current Price | Fair Value (Est) | Discount (Est) |
| Xiamen King Long Motor Group (SHSE:600686) | CN¥9.41 | CN¥18.51 | 49.1% |
| Shizuki Electric (TSE:6994) | ¥1219.00 | ¥2362.76 | 48.4% |
| Nissui (TSE:1332) | ¥1108.00 | ¥2165.31 | 48.8% |
| Kumagai GumiLtd (TSE:1861) | ¥1214.00 | ¥2410.08 | 49.6% |
| Innocean Worldwide (KOSE:A214320) | ₩18250.00 | ₩36343.70 | 49.8% |
| Inner Mongolia ERDOS ResourcesLtd (SHSE:600295) | CN¥14.29 | CN¥28.27 | 49.4% |
| ENN Energy Holdings (SEHK:2688) | HK$50.15 | HK$97.07 | 48.3% |
| Double Medical Technology (SZSE:002901) | CN¥39.84 | CN¥79.12 | 49.6% |
| China Coal Energy (SEHK:1898) | HK$10.37 | HK$20.16 | 48.6% |
| Apex Mining (PSE:APX) | ₱17.20 | ₱33.35 | 48.4% |
Let's review some notable picks from our screened stocks.
Innocean Worldwide (KOSE:A214320)
Overview: Innocean Worldwide Inc. offers marketing and communications services across various regions including the Americas, Europe, Asia, Oceania, and the Middle East with a market cap of ₩730 billion.
Operations: The company generates revenue primarily from its advertising agency services, amounting to approximately ₩2.15 trillion.
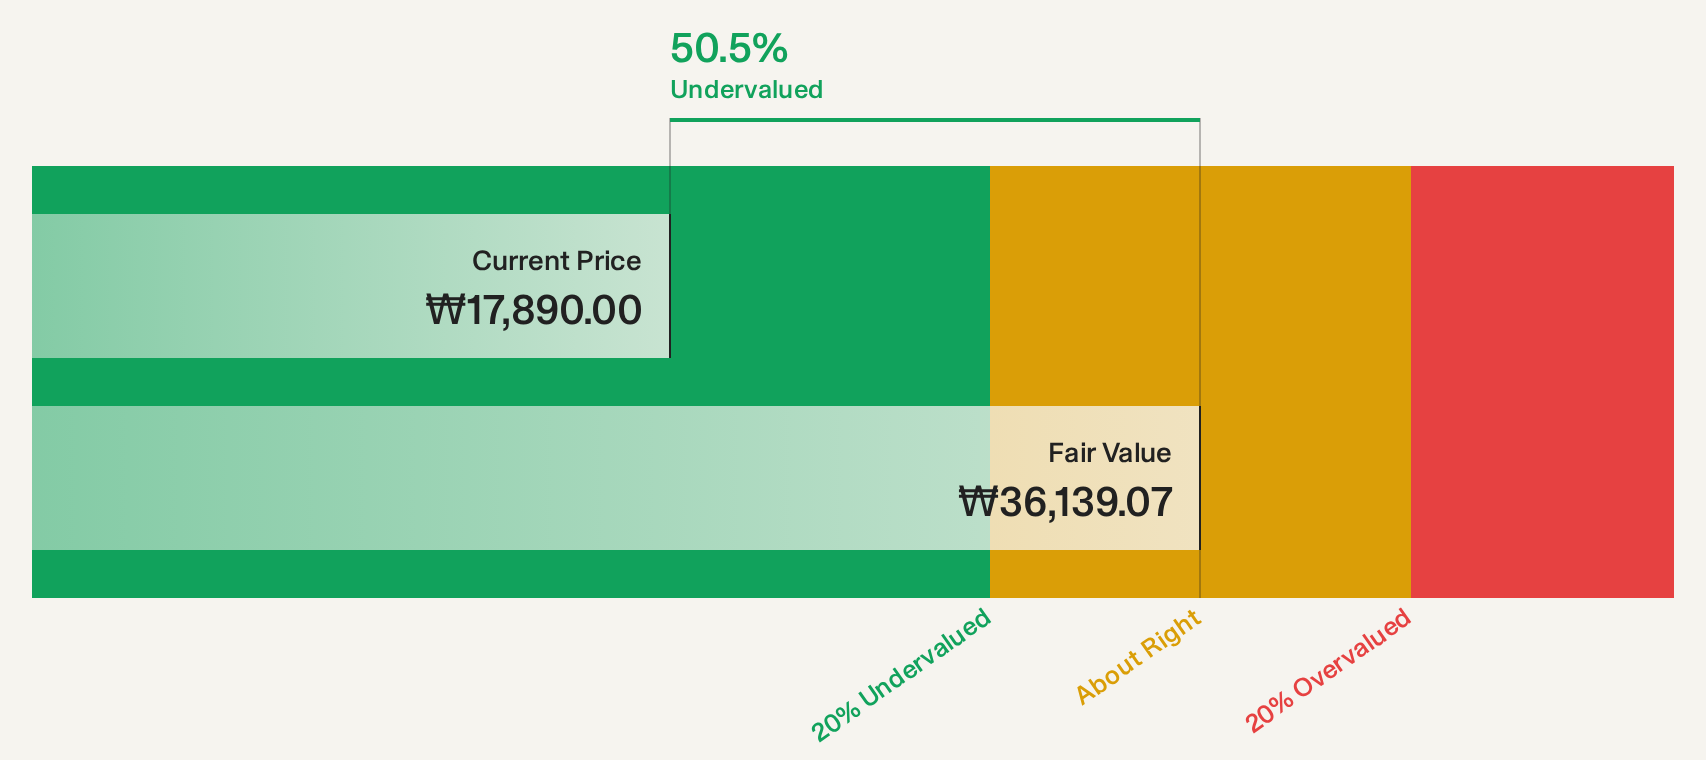
Estimated Discount To Fair Value: 49.8%
Innocean Worldwide is currently trading at ₩18,250, significantly below its estimated future cash flow value of ₩36,343.7. Despite a recent 53.2% growth in earnings over the past year, revenue and earnings growth forecasts remain modest compared to market averages. Analysts suggest potential price appreciation of 33.9%, but the company's return on equity is expected to be low at 10.1% in three years, and it has an unstable dividend track record.
- In light of our recent growth report, it seems possible that Innocean Worldwide's financial performance will exceed current levels.
- Click here to discover the nuances of Innocean Worldwide with our detailed financial health report.
Anhui Zhongding Sealing Parts (SZSE:000887)
Overview: Anhui Zhongding Sealing Parts Co., Ltd. operates in the research, development, production, and sale of hydraulic and pneumatic seals as well as automotive non-tire rubber products both domestically and internationally, with a market cap of CN¥23.33 billion.
Operations: The company's revenue is primarily derived from the Automotive Industry, contributing CN¥19.15 billion, while the Non-Automotive Industry accounts for CN¥895.45 million.
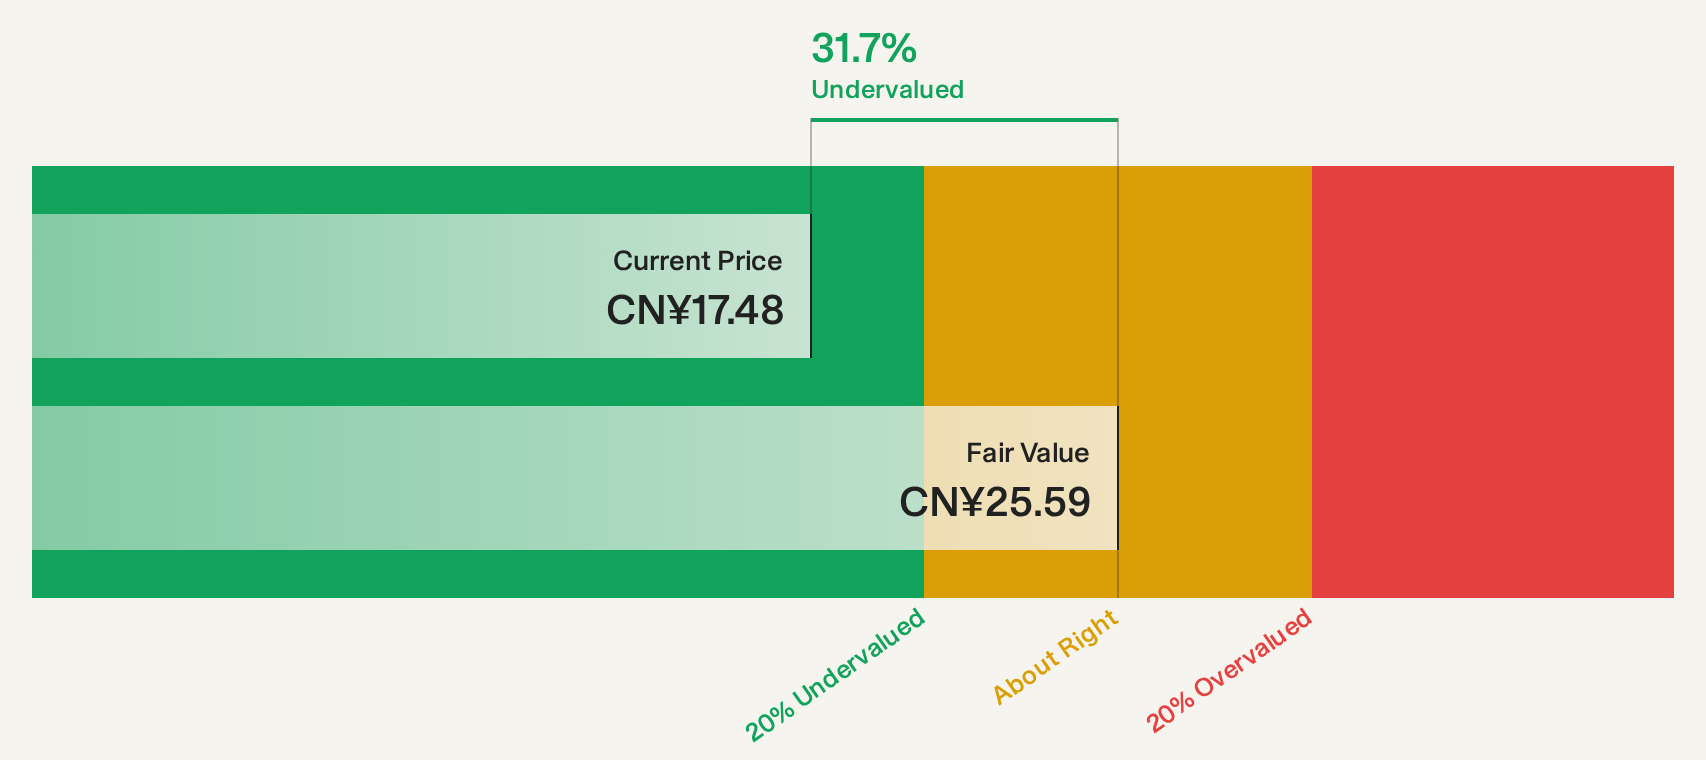
Estimated Discount To Fair Value: 31%
Anhui Zhongding Sealing Parts is trading at CN¥17.72, below its estimated future cash flow value of CN¥25.67, suggesting undervaluation. Despite a 7.4% earnings growth last year, revenue and earnings growth forecasts trail behind the market averages in China. Analysts foresee a 66.5% potential price increase, though return on equity is projected to be low at 10.9% in three years amid recent executive changes and amendments to company bylaws.
- Upon reviewing our latest growth report, Anhui Zhongding Sealing Parts' projected financial performance appears quite optimistic.
- Get an in-depth perspective on Anhui Zhongding Sealing Parts' balance sheet by reading our health report here.
Vertex (TSE:5290)
Overview: Vertex Corporation manufactures and sells concrete secondary products in Japan, with a market cap of ¥61.95 billion.
Operations: The company's revenue is primarily derived from its Concrete Business at ¥28.37 billion, followed by the Disaster Prevention Business at ¥4.91 billion and the Pile Business at ¥2.55 billion.
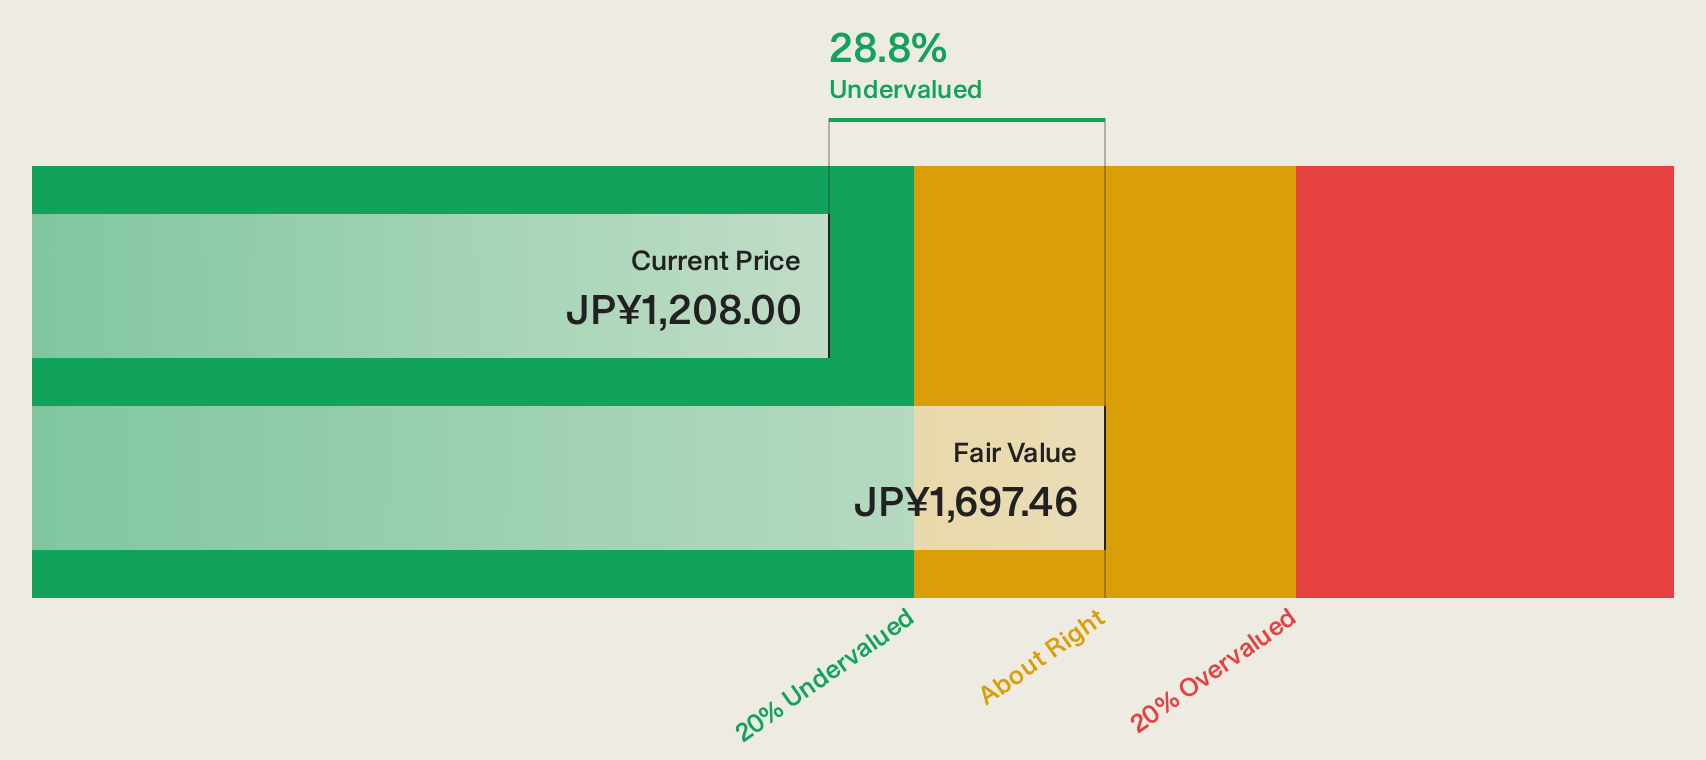
Estimated Discount To Fair Value: 26.8%
Vertex Corporation is trading at ¥1,258, significantly below its estimated future cash flow value of ¥1,719.75, indicating potential undervaluation. Despite recent earnings growth of 97.7%, forecasts suggest a decline in earnings by an average of 29.7% annually over the next three years. Recent buybacks totaling ¥758.46 million and inclusion in the S&P Global BMI Index highlight strategic moves, yet revenue growth remains modest at 7.5% per year compared to market averages.
- Our comprehensive growth report raises the possibility that Vertex is poised for substantial financial growth.
- Click here and access our complete balance sheet health report to understand the dynamics of Vertex.
Taking Advantage
- Discover the full array of 174 Undervalued Asian Stocks Based On Cash Flows right here.
- Already own these companies? Link your portfolio to Simply Wall St and get alerts on any new warning signs to your stocks.
- Maximize your investment potential with Simply Wall St, the comprehensive app that offers global market insights for free.
Seeking Other Investments?
- Explore high-performing small cap companies that haven't yet garnered significant analyst attention.
- Diversify your portfolio with solid dividend payers offering reliable income streams to weather potential market turbulence.
- Fuel your portfolio with companies showing strong growth potential, backed by optimistic outlooks both from analysts and management.
This article by Simply Wall St is general in nature. We provide commentary based on historical data and analyst forecasts only using an unbiased methodology and our articles are not intended to be financial advice. It does not constitute a recommendation to buy or sell any stock, and does not take account of your objectives, or your financial situation. We aim to bring you long-term focused analysis driven by fundamental data. Note that our analysis may not factor in the latest price-sensitive company announcements or qualitative material. Simply Wall St has no position in any stocks mentioned.
Have feedback on this article? Concerned about the content? Get in touch with us directly. Alternatively, email editorial-team@simplywallst.com