
First Bank Of Toyama (TSE:7184), What Is Behind The Fresh Attention?
Fresh commentary around First Bank Of Toyama (TSE:7184) has zeroed in on a tension. Multi year share gains now sit against estimates suggesting intrinsic value lags the current market price.
Recent trading shows that momentum around First Bank Of Toyama has cooled at the edges, with a 7 day share price return of 3.20% lower and a 30 day share price return down 1.70%, even as the 90 day share price return of 19.95% and a very large 5 year total shareholder return of roughly 13x keep the longer term picture strong against the current valuation debate.
Spot potential valuation gaps by comparing First Bank Of Toyama with a curated 13 high quality undervalued stocks that includes companies with solid cash flows and balance sheets that still trade below their estimated worth.Bulls point to First Bank Of Toyama’s powerful multi year total returns, while bears highlight an estimated intrinsic value that trails the share price. Which side does the current valuation math support?
Price-to-Earnings of 11.9x: Is it justified?
First Bank Of Toyama trades on a P/E of 11.9x, a level that sits below both the wider JP market on 14x and the JP Banks sector on 14.6x. That gap means investors are currently paying less for each ¥ of earnings at First Bank Of Toyama than for many listed peers, even after the strong multi year share price performance.
The P/E multiple tells you how much the market is willing to pay for the bank’s current profits. For a lender like First Bank Of Toyama, that lens matters because earnings are a direct product of its loan book, funding costs, and fee income rather than a distant promise of future growth. A lower P/E can sometimes signal caution around sustainability of recent earnings, but it can also reflect that enthusiasm has not fully caught up with recent profitability trends.
Recent fundamentals give both camps material to work with. Earnings have grown by 73.3% over the past year and by 34% per year over the past 5 years, with net profit margins now at 33% compared with 25.6% a year earlier. Those figures indicate strong recent profit momentum, yet the SWS DCF model estimates a future cash flow value of ¥2,720.87 per share against a last close of ¥3,475, so the current market price sits above that cash flow based valuation even while the P/E screens cheaper than averages.
Against peers, the discount is clear. The P/E of 11.9x sits below the JP Banks industry average of 14.6x and also below the broader JP market multiple of 14x, which points to a market that prices First Bank Of Toyama’s earnings more conservatively than both its sector and the overall equity universe. That combination of a lower earnings multiple and a share price above the SWS DCF estimate underlines how different valuation tools can point in different directions at the same time.
See what the numbers say about this price — find out in our valuation breakdown.
Result: Price-to-Earnings of 11.9x (ABOUT RIGHT)
Still, the First Bank Of Toyama story could be knocked off course if earnings soften against current expectations or if sector wide sentiment toward Japanese banks cools.
Find out about the key risks to this First Bank Of Toyama narrative.
Another View: DCF Flags a Richer Price For First Bank Of Toyama
There is a different signal when you switch from the P/E lens to the SWS DCF model. On this view, First Bank Of Toyama’s estimated future cash flow value is ¥2,720.87 per share, while the recent market price is ¥3,475. The stock screens as overvalued on this method, which leaves investors weighing whether earnings strength justifies paying above that cash flow estimate.
Look into how the SWS DCF model arrives at its fair value.
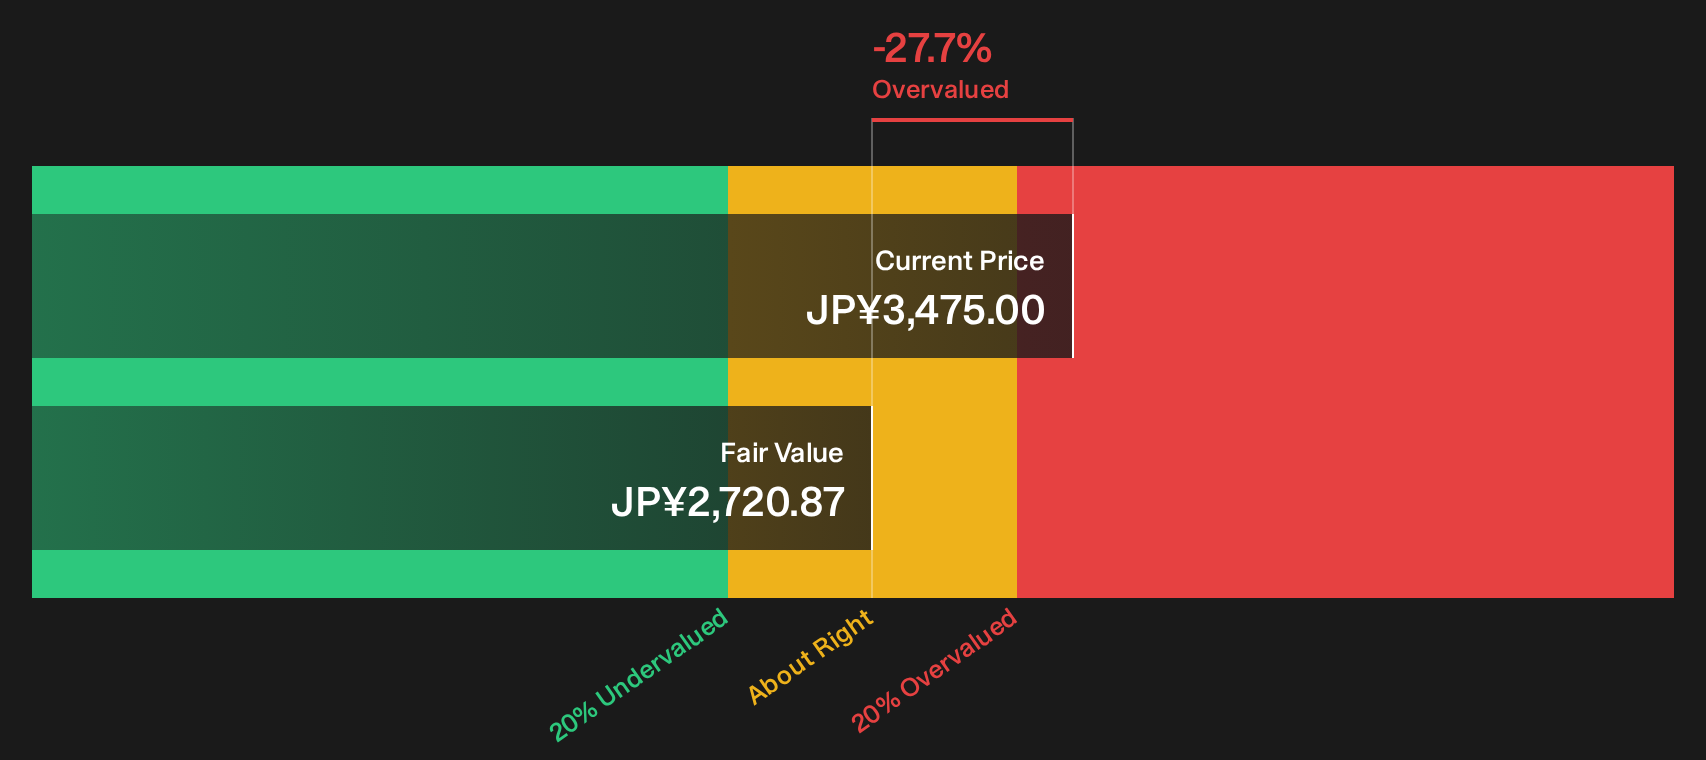
Simply Wall St performs a discounted cash flow (DCF) on every stock in the world every day (check out First Bank Of Toyama for example). We show the entire calculation in full. You can track the result in your watchlist or portfolio and be alerted when this changes, or use our stock screener to discover 13 high quality undervalued stocks. If you save a screener we even alert you when new companies match - so you never miss a potential opportunity.
Next Steps
Conflicted on what all this says about First Bank Of Toyama right now. Act quickly, pull up the underlying figures, and weigh both sides using the 2 key rewards and 4 important warning signs.
Looking for more investment ideas beyond First Bank Of Toyama?
If you stop with First Bank Of Toyama, you miss chances elsewhere. Cast a wider net and compare different setups side by side using the Simply Wall St screener.
- Target stronger balance sheets by reviewing companies on our list of solid balance sheet and fundamentals (22 results) that pair financial resilience with healthier fundamentals.
- Hunt for mispriced opportunities by scanning the 13 high quality undervalued stocks that highlights stocks combining solid cash flows with compressed valuations.
- Build a steadier income stream by reviewing the 29 dividend fortresses that focuses on higher yielding businesses with more robust payout profiles.
This article by Simply Wall St is general in nature. We provide commentary based on historical data and analyst forecasts only using an unbiased methodology and our articles are not intended to be financial advice. It does not constitute a recommendation to buy or sell any stock, and does not take account of your objectives, or your financial situation. We aim to bring you long-term focused analysis driven by fundamental data. Note that our analysis may not factor in the latest price-sensitive company announcements or qualitative material. Simply Wall St has no position in any stocks mentioned.
Have feedback on this article? Concerned about the content? Get in touch with us directly. Alternatively, email editorial-team@simplywallst.com