
Schneider National (SNDR) Dropped, So What Is Drawing Attention Now?
Schneider National (SNDR) has drawn fresh attention after its share price closed at US$30.47. The transportation group reported US$5.8b in revenue and US$111.6m in net income over its latest reported year.
Recent trading has been choppy for Schneider National, with the share price down 3.3% over the past day and 6.6% over the past month. The 1-year total shareholder return of 31.0% points to earlier momentum that now appears to be fading in the short term.
Compare Schneider National's recent swing with a curated list of transport and logistics players that our analysts rate for balance sheet strength and fundamentals via the list of solid balance sheet and fundamentals (25 results).
After a strong 1-year gain but a rougher recent stretch, Schneider National now asks a simple question of investors: Does the current price still offer enough upside potential to justify the risks on the table?
Most Popular Narrative: 15% Undervalued
On the most followed view, Schneider National screens as undervalued, with a narrative fair value of about $35.86 against the latest close at $30.47. That gap rests on a detailed set of assumptions about volume mix, margins, and capital discipline rather than a simple chart read.
Further expansion of Intermodal offerings, especially in Mexico and Eastern lanes where Intermodal has recorded nine consecutive quarters of order growth and 17 consecutive quarters of Mexico volume growth with service that is reported as faster and highly claims free, positions Schneider National to capture more over the road conversion and support revenue growth and Intermodal operating income.
See why 6 investors see Schneider National as 15% undervalued.
Result: Fair Value of $35.86 (UNDERVALUED)
Still, the Schneider National thesis could be shaken if freight demand softens again and spot pricing or Dedicated customer churn undercuts the margin story that analysts are banking on.
Find out about the key risks to this Schneider National narrative.
Another View: What Multiples Say About Schneider National
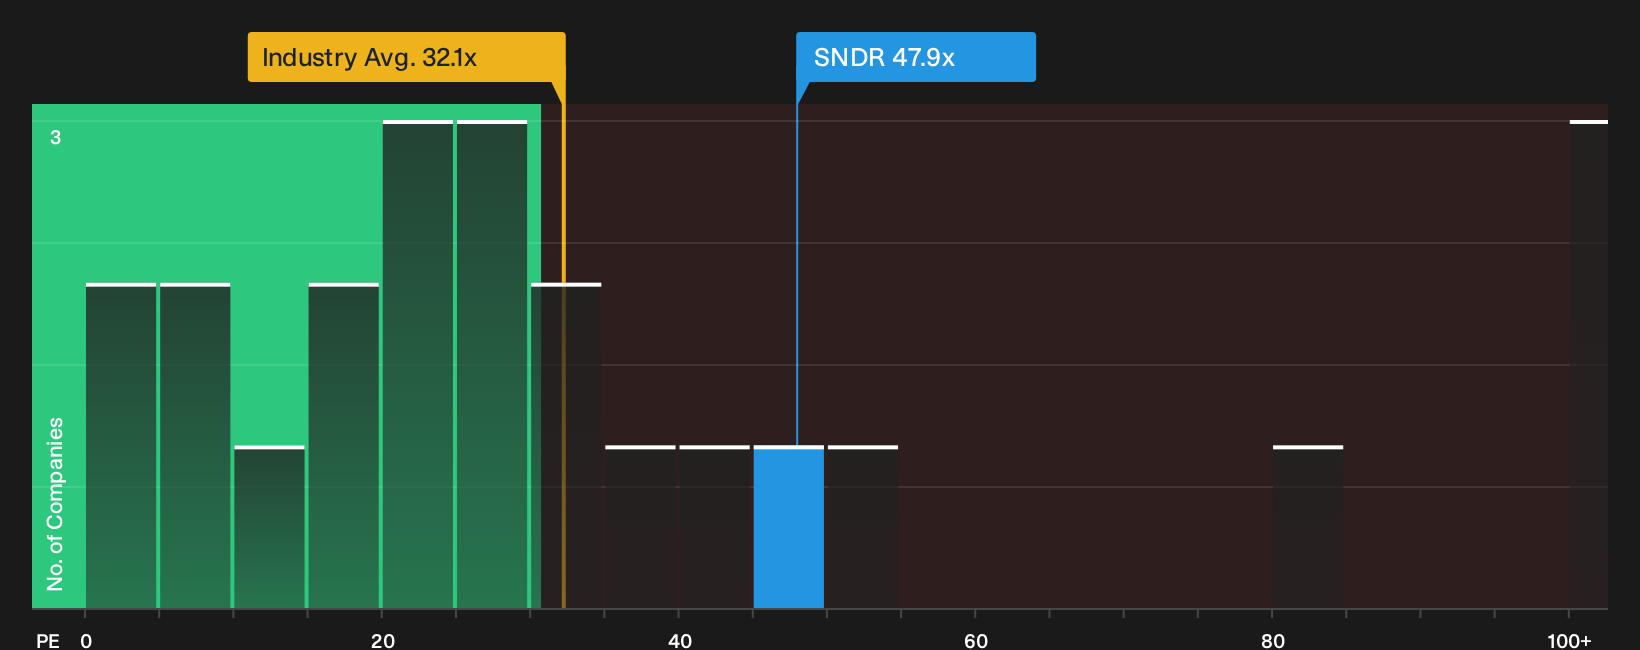
The SWS DCF model points to Schneider National trading at a steep discount to an estimated future cash flow value of $186.54, while the current P/E of 47.9x is richer than both the US Transportation sector at 32.1x and an SWS fair ratio of 32.3x. That mix of being cheap on cash flow yet expensive on earnings raises a simple question for you as an investor: Which signal matters more for your risk tolerance and time horizon?
See what the numbers say about this price — find out in our valuation breakdown.
Next Steps
Sentiment around Schneider National is mixed, and that is exactly why fresh eyes on the numbers can matter. Take a few minutes to review the data, pressure test the assumptions, and then weigh those positives against your own risk tolerance using the 2 key rewards.
Looking for more investment ideas beyond Schneider National?
If Schneider National has sharpened your focus on quality, do not stop here. Broader idea hunting can reveal opportunities that fit your goals even better.
- Spot potential high-return outliers early and sort through 12 elite penny stocks with strong financials that pair smaller market sizes with stronger financial profiles than many expect.
- Zero in on quality at a reasonable price by scanning the 35 high quality undervalued stocks that combine solid cash generation with conservative balance sheets.
- Prioritise consistency and defence by reviewing the 32 resilient stocks with low risk scores that screen well on resilience scores and business fundamentals.
Have feedback on this article? Concerned about the content? Get in touch with us directly. Alternatively, email editorial-team@simplywallst.com