
Equinix (EQIX) Faces A Valuation Test, Is The Pullback A Buying Chance?
Equinix (EQIX) is back in focus after fresh coverage highlighted its 2.09% dividend yield, five dividend raises in five years, and an average annual dividend growth rate of 13.62%.
Recent trading has been choppy for Equinix, with the share price down 1.04% on the day, 5.51% over the past week, and 5.08% over the last three months. However, the year-to-date share price return of 27.69%, alongside a 1-year total shareholder return of 20.78%, points to momentum that has cooled in the short term but remains strong over a longer holding period as investors weigh income potential against changing expectations around growth and risk.
Scan beyond Equinix and compare its income profile with a curated 8 dividend fortresses that puts yield and resilience at the forefront.
After a near 28% gain this year followed by a pullback, Equinix now sits at an awkward middle ground. Is most of the easy money already made, or do the current numbers still hint at meaningful upside ahead?
Most Popular Equinix Narrative: 20.9% Undervalued
On the numbers, Equinix closed at $975.71 compared with a widely followed fair value estimate of $1,233.23. This frames the current pullback as a discount that hinges on how much growth investors think the business can actually convert from its development pipeline and AI driven demand.
Equinix plans to invest US$5b to US$7b per year in development from 2027 to 2029, targeting low to mid 20% cash on cash returns with 2 to 3 year stabilizations. If achieved, this could support higher revenue and AFFO growth than currently reflected in the stock.
See why 93 investors see Equinix as 21% undervalued.
Result: Fair Value of $1,233.23 (UNDERVALUED)
Still, the bullish Equinix story can crack if power grid bottlenecks slow new builds or if higher construction and financing costs compress those targeted project returns.
Find out about the key risks to this Equinix narrative.
Another View: Equinix Through The P/E Lens
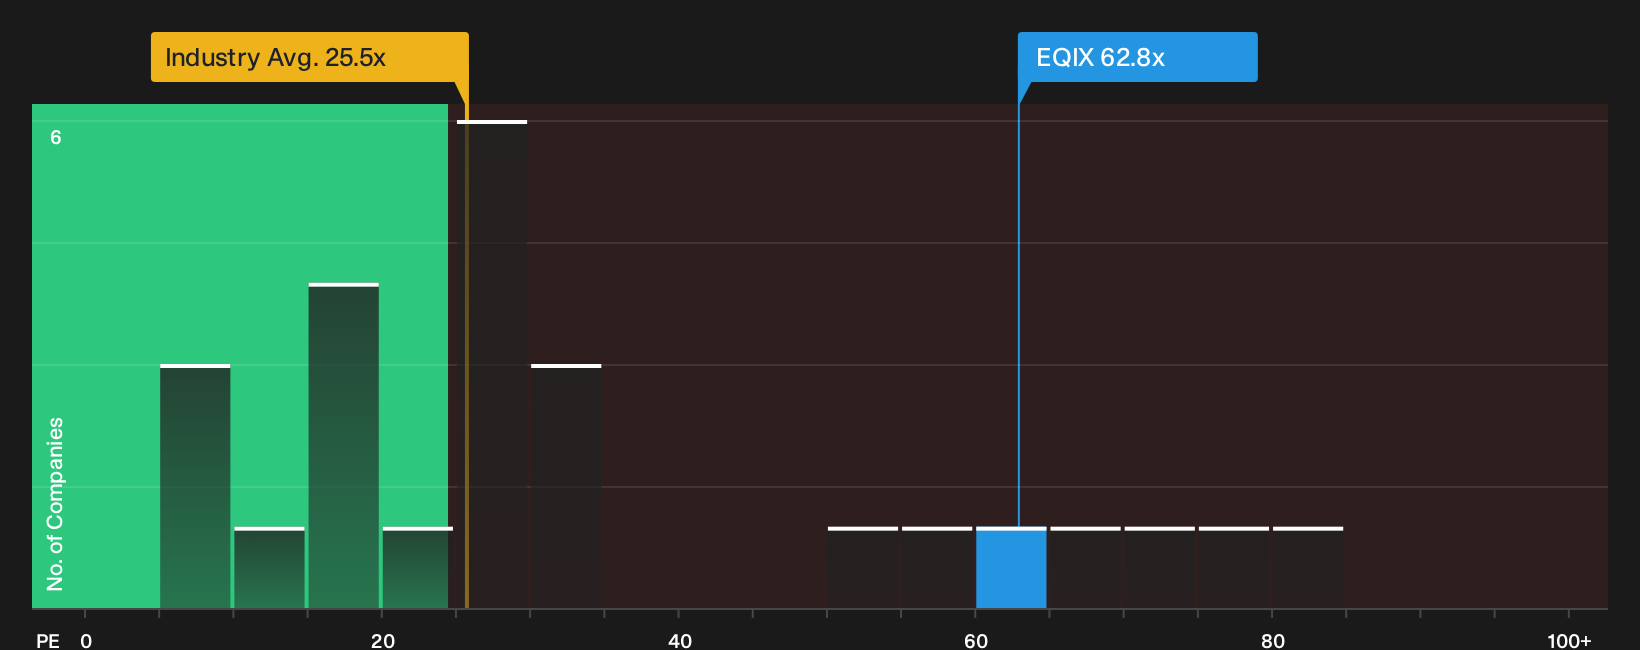
The first fair value story paints Equinix as 20.9% undervalued, yet its current P/E ratio of 62.8x tells a very different story. That multiple is far above the North American Specialized REITs average of 25.5x, the peer average of 38.5x, and even the fair ratio of 37.5x that the market could move toward over time.
If sentiment cools and the valuation drifts closer to that fair ratio, the gap between today’s price and those lower multiples could translate into meaningful valuation risk for anyone buying at current levels. The question for you is simple: Which story feels more realistic for Equinix over your own holding period, the discounted cash flow view or the rich P/E profile? See what the numbers say about this price — find out in our valuation breakdown.
Next Steps
Mixed messages on Equinix’s value story can be useful. Let that tension push you to the data, then weigh the 5 key rewards and 2 important warning signs for yourself.
Looking For More Ideas Beyond Equinix?
Do not stop with Equinix. Put a shortlist together using focused screeners that surface different types of opportunities other investors might be ignoring.
- Target quality at a discount by scanning a curated 35 high quality undervalued stocks that filters for strong fundamentals first and attractive pricing second.
- Strengthen your downside protection by running a 32 resilient stocks with low risk scores that prioritizes resilient balance sheets and steadier return profiles.
- Spot potential early movers by checking a 20 high quality undiscovered gems built to highlight under-followed companies with solid financial footing.
Have feedback on this article? Concerned about the content? Get in touch with us directly. Alternatively, email editorial-team@simplywallst.com