
Is Wanguo Gold Group (SEHK:3939) Overvalued As Its High P/E Draws Fresh Scrutiny?
Recent debate around Wanguo Gold Group (SEHK:3939) has focused on its elevated P/E compared with the wider Metals and Mining sector, putting the stock’s valuation and earnings power firmly under the microscope for investors.
Wanguo Gold Group’s share price has pulled back recently, with a 1-day share price return of a 2.10% decline and a 30-day share price return of a 17.78% decline. However, the year-to-date share price return of 65.69% and very large 3-year total shareholder return indicate that momentum has been strong over a longer horizon as investors reassess how much to pay for that higher P/E.
Scan beyond Wanguo Gold Group and compare its rich P/E against 36 elite gold producer stocks, which also balances production scale, balance sheet strength and earnings quality.
After a rapid multi year climb and a sharp recent pullback, Wanguo Gold Group now presents a simple trade off: Is meaningful upside still ahead, or did most of the payoff already occur on the way up?
Preferred P/E of 29.5x: Is it justified?
The valuation signal on Wanguo Gold Group is clear from the numbers. At a P/E of 29.5x against a last close of HK$13.04, the stock is priced far above both the Hong Kong Metals and Mining sector average of 8.9x and the peer group average of 15.6x. Simply Wall St’s DCF work suggests HK$13.04 is well below an estimated future cash flow value of HK$80.34.
The P/E ratio compares the current share price with earnings per share. For a miner like Wanguo Gold Group, it reflects how much investors are willing to pay for each unit of current profit from its China and Solomon Islands operations, and how much confidence they place in that earnings profile.
A P/E of 29.5x implies the market is paying a steep premium to the sector for Wanguo Gold Group’s profitability and growth story. The same framework suggests a fair P/E near 22.5x, which is materially lower than where the shares trade today and indicates a level that valuations could move toward if optimism cools.
The comparison to peers is even starker. Against the Hong Kong Metals and Mining industry at 8.9x, Wanguo Gold Group’s 29.5x multiple is more than triple the sector yardstick. It also sits well above the estimated fair P/E of 22.5x, which marks a much less aggressive stance on the earnings outlook.
Explore the SWS fair ratio for Wanguo Gold Group.
Result: Price-to-Earnings of 29.5x (OVERVALUED)
Still, the story around Wanguo Gold Group can change quickly if project execution stumbles in the Solomon Islands or if metal prices weaken and squeeze earnings expectations.
Find out about the key risks to this Wanguo Gold Group narrative.
Another View on Wanguo Gold Group’s Value
The P/E math paints Wanguo Gold Group as expensive, yet the SWS DCF model points in the opposite direction. At HK$13.04, the shares sit well below an estimated future cash flow value of HK$80.34, which indicates a very wide gap between the two measures. Which signal should matter more for you?
Look into how the SWS DCF model arrives at its fair value.
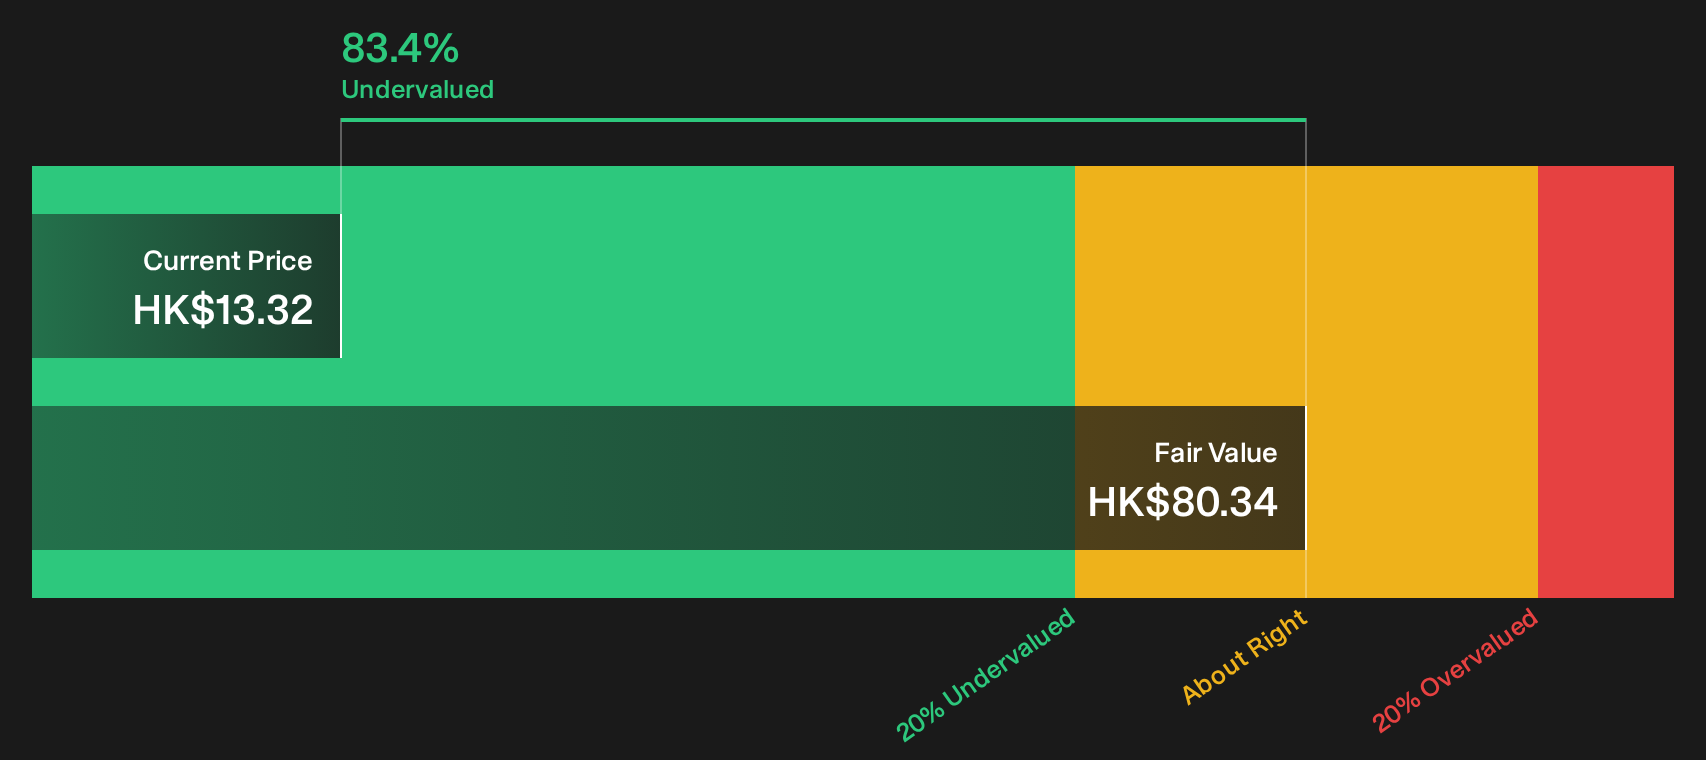
Simply Wall St performs a discounted cash flow (DCF) on every stock in the world every day (check out Wanguo Gold Group for example). We show the entire calculation in full. You can track the result in your watchlist or portfolio and be alerted when this changes, or use our stock screener to discover 198 high quality undervalued stocks. If you save a screener we even alert you when new companies match - so you never miss a potential opportunity.
Next Steps
Mixed signals on Wanguo Gold Group’s valuation can feel messy, yet that tension is exactly why the data matters. Act while the details are fresh and weigh the upside against the downside by reviewing the 3 key rewards and 1 important warning sign
Looking for more investment ideas beyond Wanguo Gold Group?
You have done the hard work on Wanguo Gold Group already. Now widen the opportunity set and pressure test your thinking against other potential candidates before the next move.
- Spot potential value plays early by scanning companies filtered as 198 high quality undervalued stocks that combine earnings strength with more modest valuations.
- Strengthen your defensive side by reviewing 230 resilient stocks with low risk scores that score well on resilience and financial risk checks.
- Get ahead of the crowd by tracking 614 high quality undiscovered gems that pair healthy fundamentals with relatively low market attention.
Have feedback on this article? Concerned about the content? Get in touch with us directly. Alternatively, email editorial-team@simplywallst.com