
Lygend Resources & Technology (SEHK:2245) Rebounds On Undervalued P E Question
Fresh attention on Lygend Resources & Technology (SEHK:2245) stems from its current valuation. Recent commentary highlights a P/E of about 5.9x versus roughly 8.9x for the wider Metals and Mining group.
The HK$18.39 share price has slipped over the past week and year to date, yet the 30 day share price return of 5.51% and 90 day gain of 36.83% suggest momentum has recently improved. The 3 year total shareholder return of about 1.9x still points to a strong longer term outcome despite a 16.23% decline over 1 year on a total return basis.
Scan other Metals and Mining opportunities with Lygend-like valuation characteristics by running our hand picked 198 high quality undervalued stocks alongside your research on Lygend Resources & Technology.
Lygend Resources & Technology has swung from a weaker year to date to a sharp 90 day rebound, yet still trades on a P/E discount. Does that mix leave more upside for new buyers, or is most of the reward already taken?
Price-to-Earnings of 5.8x: Is it justified?
Lygend Resources & Technology trades on a P/E of about 5.8x, while the Hong Kong Metals and Mining group sits nearer 8.9x. At a last close of HK$18.39, the stock changes hands at a clear discount to both its sector and a peer average of 21.5x. This suggests the market is attaching a lower earnings multiple than many rivals.
The P/E ratio compares the current share price with earnings per share. For a business like Lygend Resources & Technology, which is involved in nickel production, smelting, trading and related services, the metric gives a quick sense of how much investors are paying for each unit of profit in a cyclical, commodity exposed industry.
Recent results show earnings growth of 59.6% over the past year, ahead of a 22.6% per year pace over five years and above the 48.5% for the broader Metals and Mining group over the same recent period. Net profit margins are described as improving, from 7.2% to 8.8%, and return on equity is reported at 29.2%, which is considered high based on the stated threshold. The combination of strong profitability metrics and high quality earnings, alongside a relatively low P/E versus both industry and peer averages, suggests the market may be pricing in caution about sustainability rather than paying up for past performance.
The discount is also highlighted when comparing Lygend Resources & Technology directly with its Hong Kong Metals and Mining peers, where the 5.8x P/E is described as good value against the 8.9x group average and an even higher 21.5x peer average. That gap is substantial. If earnings and returns remain resilient, the multiple could have scope to move closer to those reference points over time, although there is no forecast data here to indicate how profits might change.
See what the numbers say about this price — find out in our valuation breakdown.
Result: Price-to-Earnings of 5.8x (UNDERVALUED)
Still, the sharp 90 day rebound after a weak year to date, together with the heavy reliance on Mainland China revenue, leaves Lygend Resources & Technology exposed if sentiment turns.
Find out about the key risks to this Lygend Resources & Technology narrative.
Another View: SWS DCF flags a different story
The low P/E makes Lygend Resources & Technology look inexpensive, yet the SWS DCF model points the other way. With the HK$18.39 share price sitting above an estimated future cash flow value of HK$10.90, the stock screens as overvalued on this method. Which signal carries more weight for you?
Look into how the SWS DCF model arrives at its fair value.
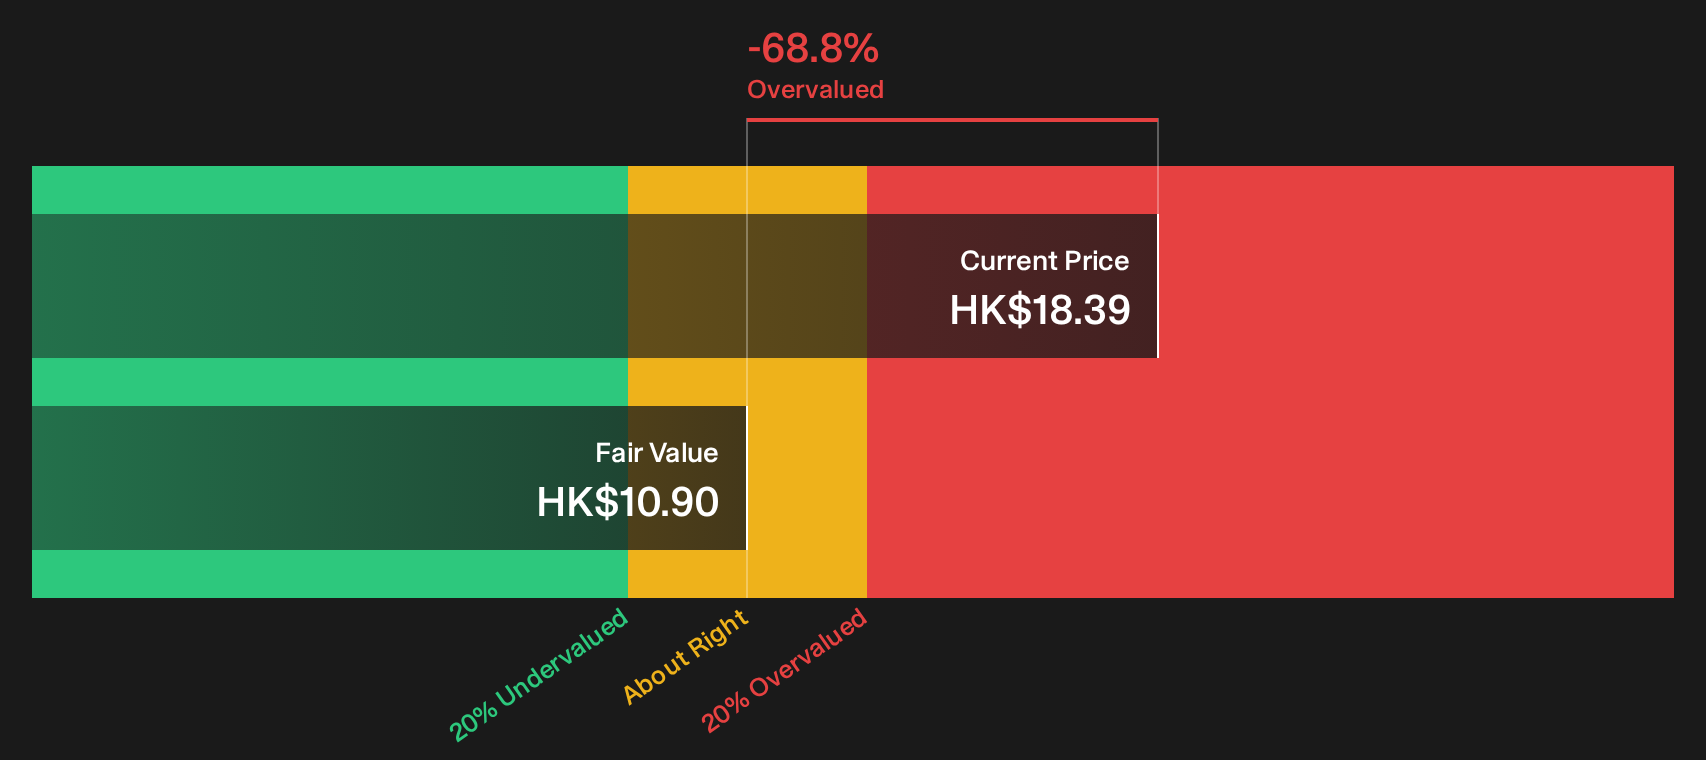
Simply Wall St performs a discounted cash flow (DCF) on every stock in the world every day (check out Lygend Resources & Technology for example). We show the entire calculation in full. You can track the result in your watchlist or portfolio and be alerted when this changes, or use our stock screener to discover 198 high quality undervalued stocks. If you save a screener we even alert you when new companies match - so you never miss a potential opportunity.
Next Steps
Mixed signals around Lygend Resources & Technology can feel confusing. Review the data now and build your own stance using the 2 key rewards and 1 important warning sign.
Looking for more investment ideas beyond Lygend Resources & Technology?
If you stop with just Lygend Resources & Technology, you risk missing other opportunities that fit your style and could sharpen your overall portfolio mix.
- Target strong balance sheets and steadier profiles by reviewing the list of solid balance sheet and fundamentals (202 results) that filters for financial resilience and healthier fundamentals.
- Hunt for companies the market may be overlooking through the 614 high quality undiscovered gems tailored to highlight quality businesses that attract less attention.
- Prioritise stability and capital preservation by scanning the 230 resilient stocks with low risk scores focused on resilient stocks with lower risk scores.
Have feedback on this article? Concerned about the content? Get in touch with us directly. Alternatively, email editorial-team@simplywallst.com