
Evercore (EVR) Leadership Reshuffle Keeps Its Undervalued Narrative In Focus
Evercore (EVR) has been reshaping its senior ranks in October 2026, capped by the appointment of veteran dealmaker John Vaske to lead coverage in its chemicals investment banking group.
Those leadership changes have occurred during a tougher period for Evercore, with the share price at US$247.96 after declining 2.41% in the last session and 27.18% over 90 days, while the 3-year total shareholder return of 97.12% still reflects strong longer term momentum.
Scan how Evercore’s leadership reshuffle compares with other financials by reviewing list of solid balance sheet and fundamentals (25 results) that could handle similar pressure.
After a near 30% year-to-date slide, Evercore now trades at levels that some investors see as a reset and others view as a warning. Which camp does the valuation math support next?
Most Popular Narrative: 34% Undervalued
On the most followed narrative, Evercore’s fair value sits at $375 against a last close of $247.96, which puts a lot of weight on how its advisory engine and cost base interact over time.
The main thing that has to go right is that Evercore maintains operating leverage by balancing higher compensation and non-compensation spending with revenue growth across M&A, private capital advisory, ECM, restructuring, and EMEA advisory.
The current numbers on revenue growth, earnings growth, returns on equity, and capital returns imply that Evercore's share price does not yet fully credit the business with the profitability and shareholder distributions it is already producing.
See why 3 investors see Evercore as 34% undervalued.
Result: Fair Value of $375 (UNDERVALUED)
Still, the bullish Evercore story can unravel quickly if non compensation costs stay elevated and margin pressure continues to drag down analyst confidence in those higher earnings targets.
Find out about the key risks to this Evercore narrative.
Another View: Evercore Through The P/E Lens
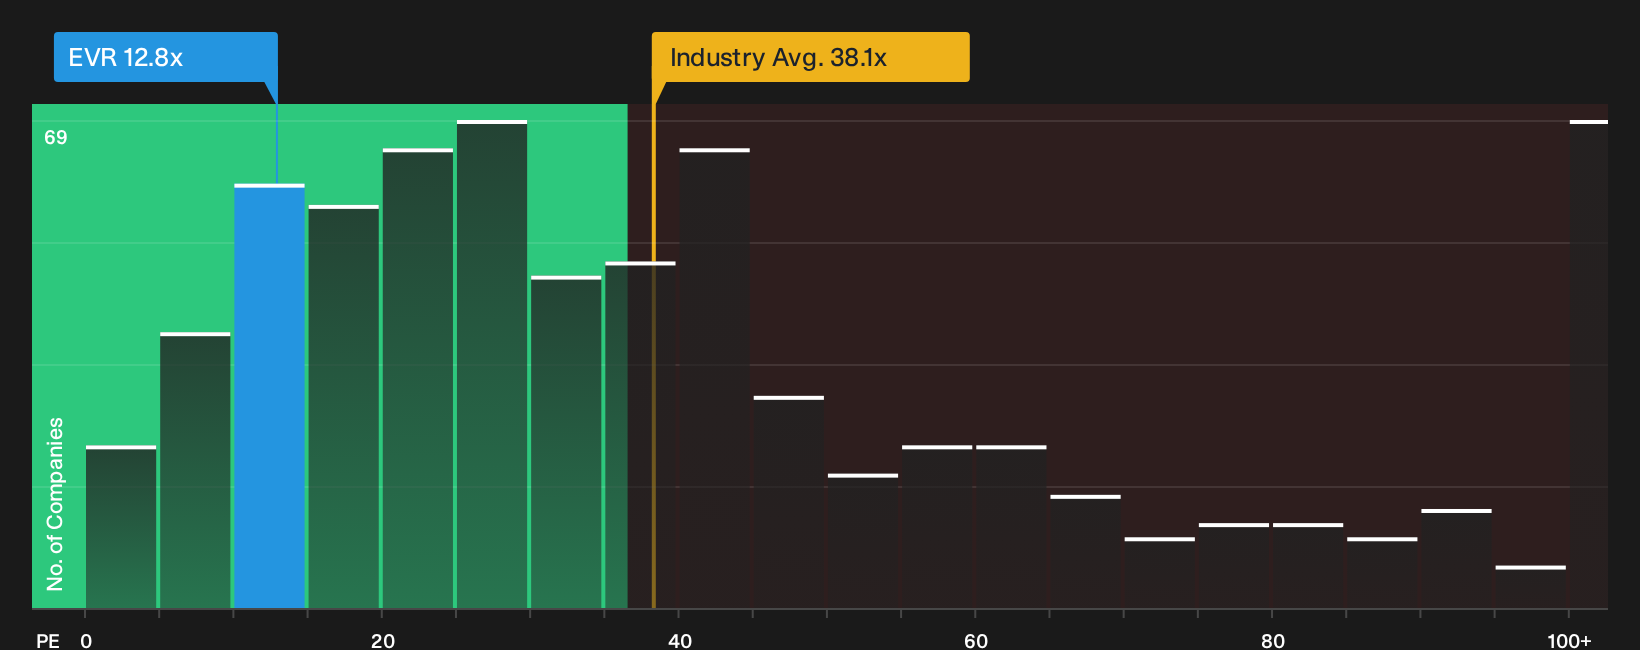
Evercore looks more complicated once the focus shifts to its P/E ratios. The shares trade on 12.8x earnings compared with a fair ratio of 12x, which flags some valuation risk, yet the multiple is far lower than the 26.8x peer average and the 38.1x for the wider US Capital Markets group.
The market is effectively charging a slight premium to Evercore’s own fair ratio while still pricing in a heavy discount to rivals. That leaves investors to judge whether that gap reflects genuine caution on future results or a potential opportunity if sentiment shifts closer to peer levels.
For a deeper look at how those P/E gaps stack up against industry and peer benchmarks, review See what the numbers say about this price — find out in our valuation breakdown.
Next Steps
Sentiment around Evercore is split, and that kind of tension is when data beats headlines. Move quickly and test your own thesis against the 4 key rewards.
Looking for more investment ideas beyond Evercore?
If Evercore has sharpened your thinking, do not stop here. Fresh ideas come from comparing quality, resilience, and value across a broader watchlist of candidates.
Use the Simply Wall Street Screener to quickly surface three very different sets of stocks that can round out your research and sharpen your conviction.
- Target income-focused opportunities and pressure test your yield watchlist against 8 dividend fortresses that combine payouts with fundamental strength.
- Hunt for quality at a discount by scanning 35 high quality undervalued stocks that pair solid cash flows with balance sheets investors may be overlooking.
- Guard the downside first and shortlist 32 resilient stocks with low risk scores that score well on resilience so one weak link does not drag your portfolio off course.
Have feedback on this article? Concerned about the content? Get in touch with us directly. Alternatively, email editorial-team@simplywallst.com