
Is Jefferies Financial Group (JEF) Undervalued After Its Fresh Bond Deals?
Jefferies Financial Group’s fresh bond deals set the stage
Jefferies Financial Group (JEF) has been active in the bond market, announcing several fixed income offerings that range from 6.00% notes due 2029 to 7.50% securities maturing in 2046.
Bond issuance comes as Jefferies Financial Group’s recent share price has retreated, with the stock down 8.98% over the past month and 31.30% year to date, even though the 3 year total shareholder return of 47.80% and 5 year total shareholder return of 22.50% point to a stronger, longer run record.
Scan 35 high quality undervalued stocks that share Jefferies Financial Group’s focus on capital markets but currently trade at prices that some investors may view as out of sync with their fundamentals.
Jefferies Financial Group shares have slid while the latest analyst and intrinsic value estimates sit higher. Does fair value sit closer to those benchmarks or nearer to the current US$43.60 price?
Price-to-Earnings of 11.7x: Is it justified?
Jefferies Financial Group currently trades on a P/E of 11.7x, a level that looks low compared to peers while the share price has retreated to $43.60.
The P/E ratio compares what investors pay for each dollar of earnings, which matters a lot for an investment banking and capital markets group like Jefferies Financial Group where profit can move sharply with deal activity and trading conditions.
At 11.7x earnings, Jefferies Financial Group trades at a discount to the US Capital Markets industry average of 38.1x and also below the peer average of 13.8x. The estimated fair P/E of 13.1x provides one reference point for how the market may assess the relationship between sentiment, assumptions on earnings, and these valuation metrics.
Explore the SWS fair ratio for Jefferies Financial Group.
Result: Price-to-Earnings of 11.7x (UNDERVALUED)
Still, Jefferies Financial Group remains heavily exposed to swings in deal activity and trading volumes, and any setback in capital markets could pressure earnings and challenge that P/E discount story.
Find out about the key risks to this Jefferies Financial Group narrative.
Another view on Jefferies Financial Group’s value
The earlier P/E discussion paints Jefferies Financial Group as inexpensive, yet the SWS DCF model also points to the shares trading below an estimated future cash flow value of $48.26 versus the current $43.60 level. Two different tools are flashing undervalued. Is the gap a genuine opportunity or a value trap in disguise?
Look into how the SWS DCF model arrives at its fair value.
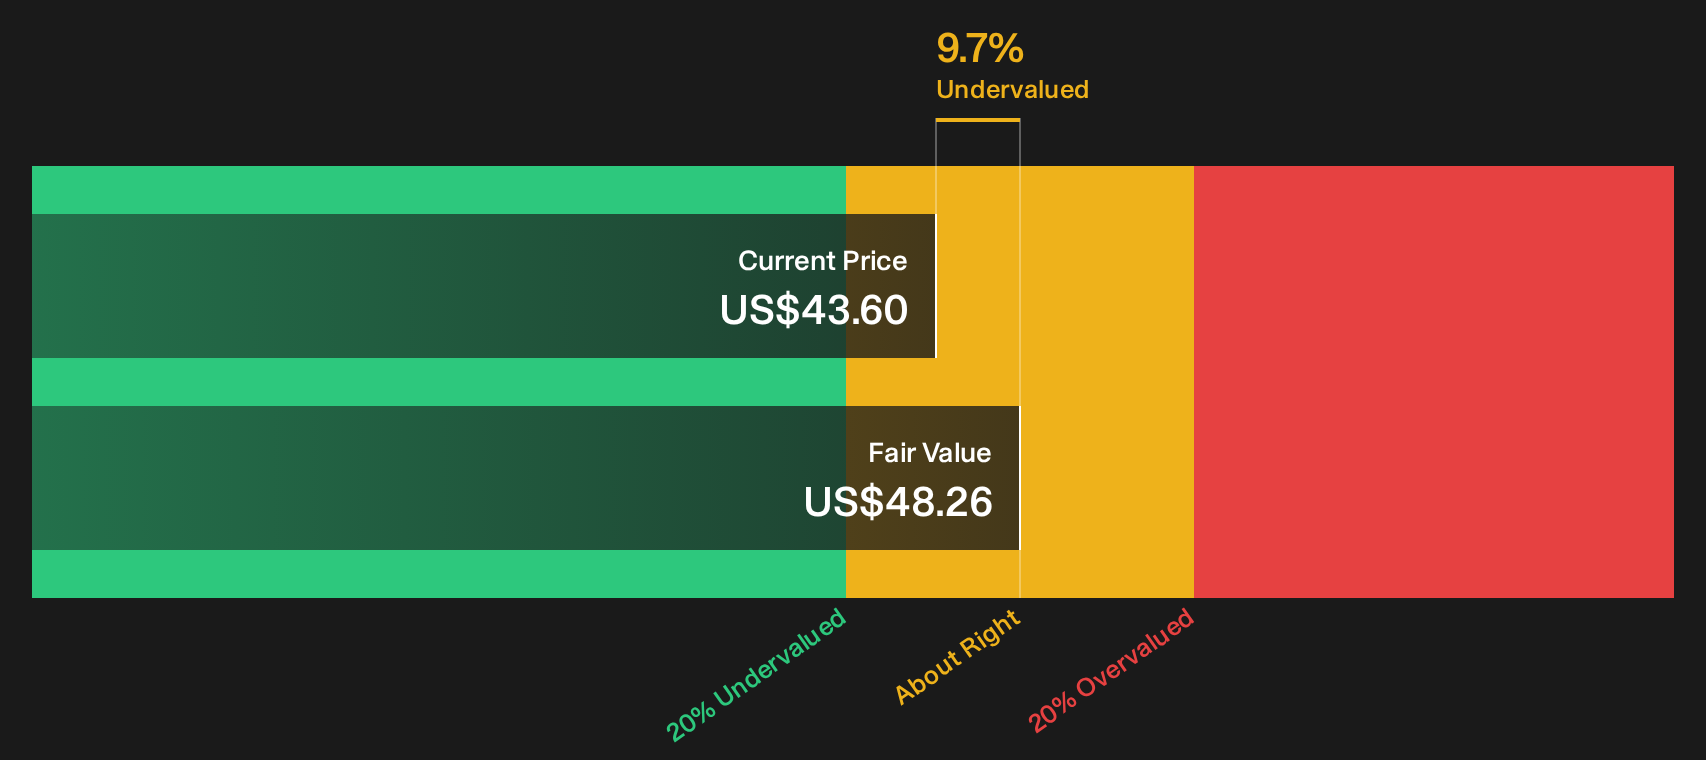
Simply Wall St performs a discounted cash flow (DCF) on every stock in the world every day (check out Jefferies Financial Group for example). We show the entire calculation in full. You can track the result in your watchlist or portfolio and be alerted when this changes, or use our stock screener to discover 35 high quality undervalued stocks. If you save a screener we even alert you when new companies match - so you never miss a potential opportunity.
Next Steps
Jefferies Financial Group has been painted as potentially mispriced throughout this piece, yet the data is there for you to interrogate yourself and act before sentiment shifts. To see which positives investors are focusing on, review the 6 key rewards
Ready to hunt for more ideas beyond Jefferies Financial Group?
Do not stop with Jefferies Financial Group. Use the Simply Wall St screener to surface fresh opportunities and avoid watching the next big move pass by.
- Target resilient balance sheets and cleaner fundamentals with a curated list of solid balance sheet and fundamentals (25 results) that can help you focus on financial strength first.
- Zero in on potential mispricings by scanning a focused 35 high quality undervalued stocks that some investors use when they want value to do more of the heavy lifting.
- Hunt for under-the-radar opportunities through a handpicked 20 high quality undiscovered gems that many market participants might not be watching yet.
Have feedback on this article? Concerned about the content? Get in touch with us directly. Alternatively, email editorial-team@simplywallst.com