
MetroCity Bankshares (MCBS) Could Be 37% Below Fair Value After Dividend Declaration
Dividend announcement sets the tone
MetroCity Bankshares (MCBS) has declared a quarterly cash dividend of $0.31 per share, payable on November 13, 2026, to shareholders of record as of November 4, 2026.
Recent trading has been choppy for MetroCity Bankshares, with the share price down 4.4% over the past 90 days but still showing a strong 31.4% year to date share price return. The 3-year total shareholder return of 95.2% points to momentum built over a longer horizon as investors respond to moves like the latest dividend declaration and shifting views on risk and income potential.
Scan beyond MetroCity Bankshares and compare this dividend story with a curated 7 dividend fortresses that are also returning cash to investors right now.
MetroCity Bankshares now offers a fatter cash yield after a strong year on the screen. Does that set up a reasonable entry today, or argue for patience until volatility throws up a cheaper quote?
Preferred P/E of 12.4x: Is it justified?
On valuation, MetroCity Bankshares trades on a P/E of 12.4x, a level that lines up with a strong recent share price run but also prices the bank above its closest reference points.
The P/E ratio compares the current share price to earnings per share. For a lender like MetroCity Bankshares, it reflects what investors are willing to pay today for each dollar of profit, based on the quality of earnings, balance sheet strength, and perceived stability of the franchise.
MCBS is described as trading at 36.6% below the SWS DCF model estimate of future cash flow value of $54.46. Its 12.4x P/E is flagged as expensive compared both to its peer average of 11.6x and the broader US Banks industry on 11.5x. That combination suggests the market is assigning a richer earnings multiple while the DCF framework indicates more value in the cash flow profile. This puts the onus on each investor to judge whether recent earnings growth and a 3.36% dividend yield justify paying more per dollar of profit than sector averages.
Compared with the US Banks industry, the premium is clear. MetroCity Bankshares trades on a 12.4x P/E versus 11.5x for the sector, and the peer set average sits at 11.6x, so the stock is priced more highly than both its immediate comparison group and the wider industry on this metric.
See what the numbers say about this price — find out in our valuation breakdown.
Result: Price-to-earnings of 12.4x (OVERVALUED)
Still, the MetroCity Bankshares story can quickly look different if credit quality weakens or if funding costs rise faster than loan yields.
Find out about the key risks to this MetroCity Bankshares narrative.
Another view on MetroCity Bankshares valuation
The earnings multiple paints MetroCity Bankshares as expensive, yet the SWS DCF model points the other way. With an estimated future cash flow value of $54.46 per share against a $34.51 price, this framework flagging the stock as undervalued raises a different question. Is the gap a cushion or a signal that the cash flow model is too generous?
Look into how the SWS DCF model arrives at its fair value.
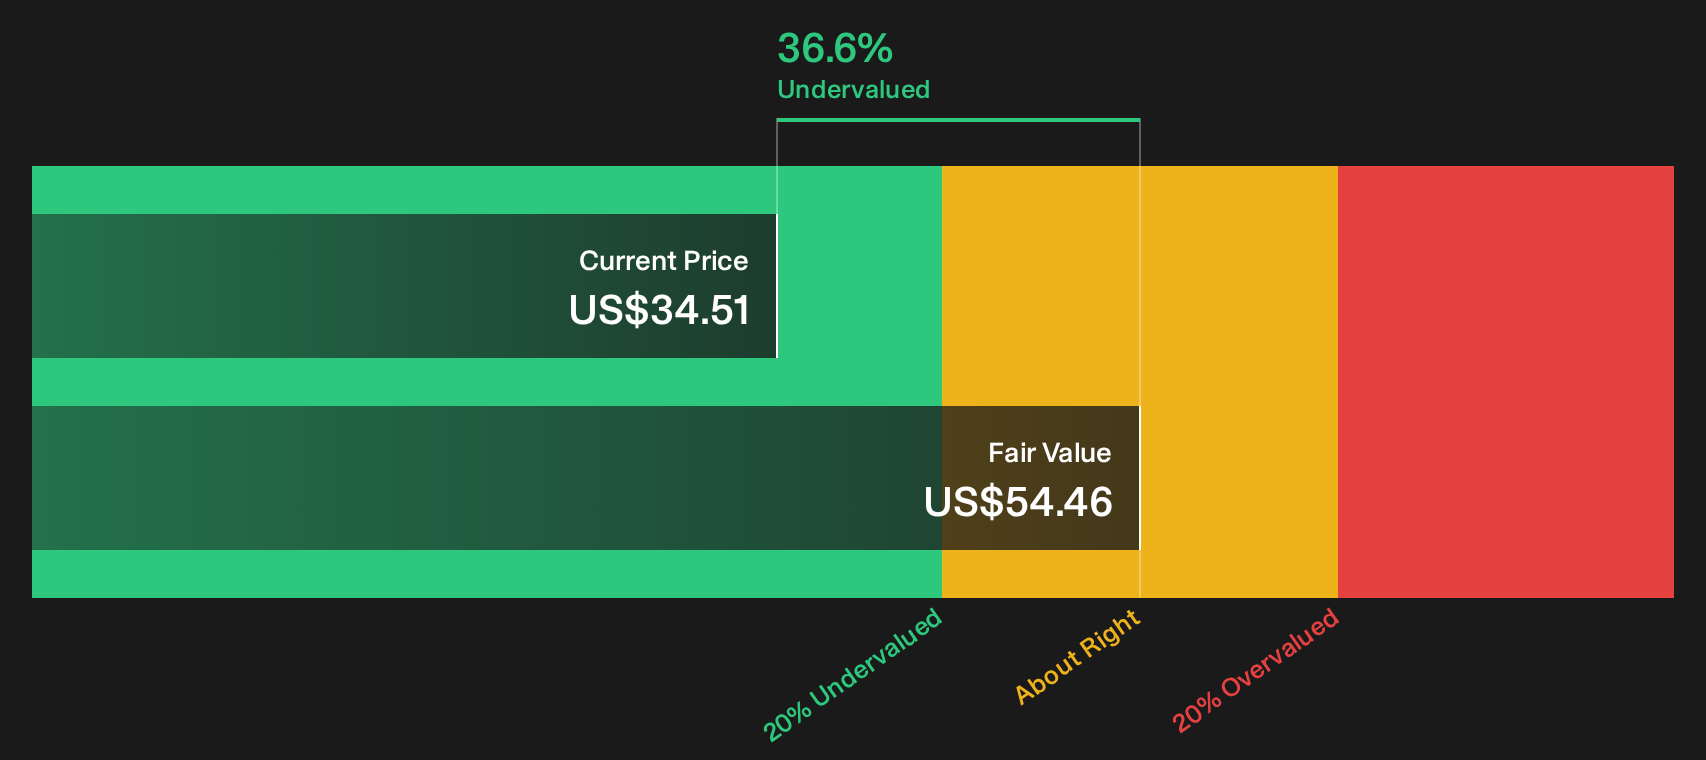
Simply Wall St performs a discounted cash flow (DCF) on every stock in the world every day (check out MetroCity Bankshares for example). We show the entire calculation in full. You can track the result in your watchlist or portfolio and be alerted when this changes, or use our stock screener to discover 33 high quality undervalued stocks. If you save a screener we even alert you when new companies match - so you never miss a potential opportunity.
Next Steps
Conflicted by the mixed signals around MetroCity Bankshares right now. Move quickly to test the numbers yourself, then weigh them against the 3 key rewards.
Looking for more MetroCity Bankshares investment ideas?
If MetroCity Bankshares has your attention, do not stop with a single ticker. A broader watchlist gives you more options when conditions shift.
- Target resilient income by reviewing a curated 7 dividend fortresses that may help you compare MetroCity Bankshares with other cash returning opportunities.
- Hunt for potential mispricing by scanning a focused 33 high quality undervalued stocks that could sit alongside MetroCity Bankshares on your radar.
- Prioritise resilience and sleep better at night by checking a 31 resilient stocks with low risk scores that might complement a position in MetroCity Bankshares.
Have feedback on this article? Concerned about the content? Get in touch with us directly. Alternatively, email editorial-team@simplywallst.com