
Why Did Farmers & Merchants Bancorp (FMCB) Shares Climb Today?
Farmers & Merchants Bancorp (FMCB) reported its third quarter 2026 earnings, posting higher net interest income and net income for both the quarter and the nine-month period.
Recent trading has echoed that stronger earnings story. Farmers & Merchants Bancorp’s share price has climbed 31.58% year to date, and the 1 year total shareholder return of 52.58% signals momentum that has been building rather than fading.
See how Farmers & Merchants Bancorp compares with other resilient regional financials by reviewing our curated list of solid balance sheet and fundamentals (26 results) that have been holding up through recent rate shifts.
For Farmers & Merchants Bancorp, a 52.58% 1 year total return can signal either a business that is finally being recognized or investors stretching for scarcity value. The next step is to see what the current valuation actually implies.
Price-to-Earnings of 10.4x: Is it justified?
Farmers & Merchants Bancorp screens as inexpensive on a simple yardstick. At a last close of $1,499.99 and a P/E of 10.4x against peers at 12.7x, the market is valuing each dollar of current earnings at a discount to similar US banks.
The P/E ratio compares the share price with earnings per share. For a lender like Farmers & Merchants Bancorp, it gives a quick sense of how much investors are willing to pay for the bank’s profit stream, which can be useful given earnings quality is flagged as high and net profit margins of 40.1% sit above last year’s level.
That gap matters. A 10.4x multiple, together with a 44.2% discount to the SWS DCF model fair value of $2,686.09, suggests the current price embeds more cautious expectations than the recent 7.6% five year earnings growth and 14.7% return on equity might imply, even with those returns described as low versus a 20% benchmark.
Compared with the US Banks industry average P/E of 11.5x, Farmers & Merchants Bancorp is on a cheaper valuation, and the SWS DCF model pointing to a fair value well above the market price reinforces that the stock is priced more conservatively than both peers and the modelled cash flow value.
See what the numbers say about this price — find out in our valuation breakdown.
Result: Price-to-Earnings of 10.4x (UNDERVALUED)
Still, the margin for error looks thin if credit quality weakens or if Farmers & Merchants Bancorp faces a sharp pullback in loan demand.
Find out about the key risks to this Farmers & Merchants Bancorp narrative.
Another View On Farmers & Merchants Bancorp’s Value
The SWS DCF model supports the idea that the headline P/E appears low. With Farmers & Merchants Bancorp at $1,499.99 against an estimated future cash flow value of $2,686.09, the gap suggests a sizable cushion if those cash flow assumptions hold. The key consideration is how comfortable you are relying on that long-range analysis when forecasts are limited.
Look into how the SWS DCF model arrives at its fair value.
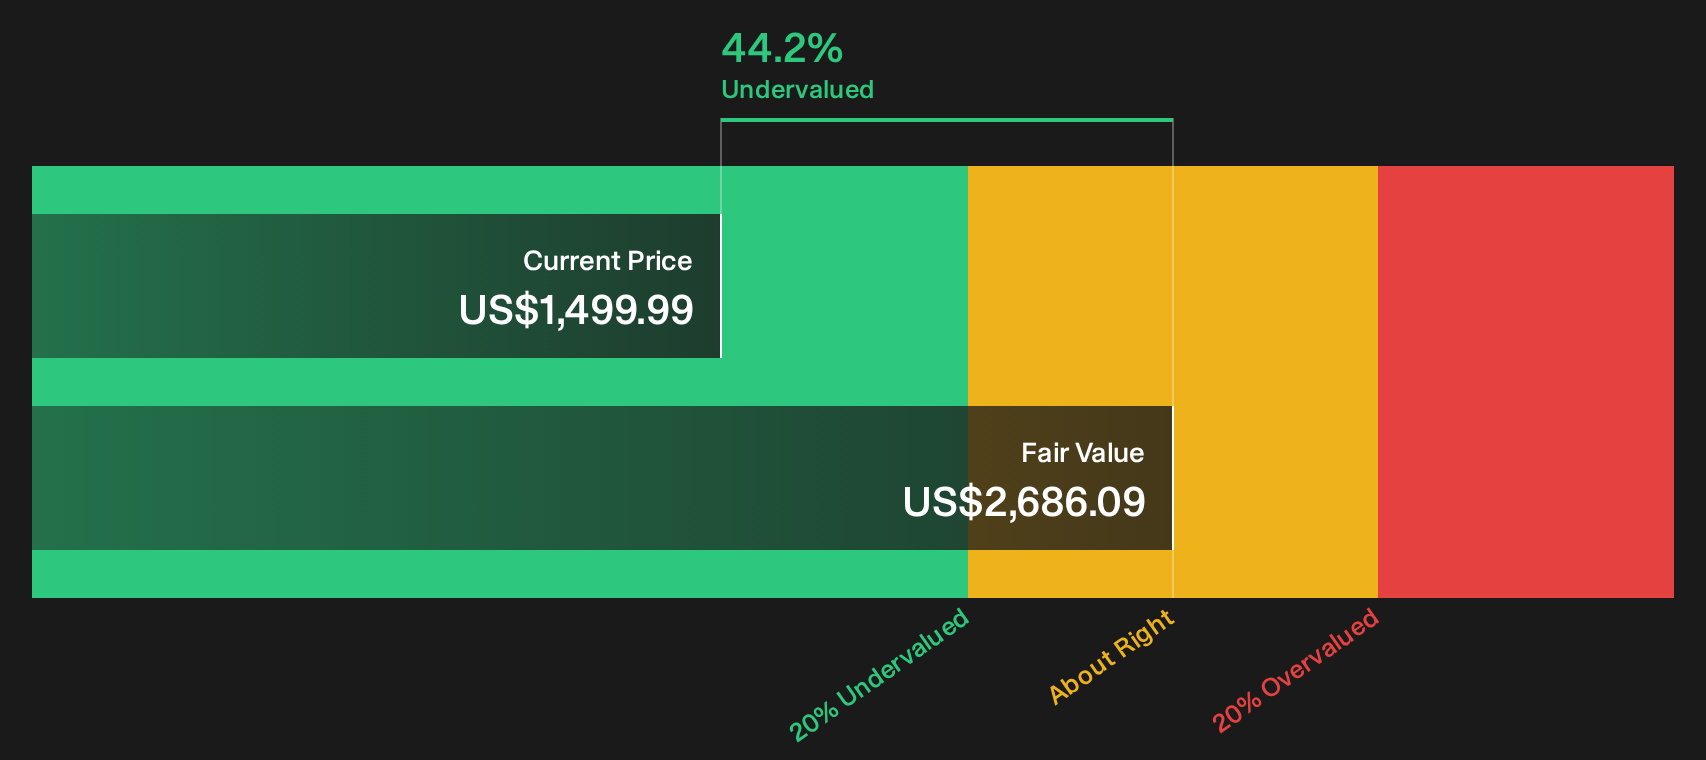
Simply Wall St performs a discounted cash flow (DCF) on every stock in the world every day (check out Farmers & Merchants Bancorp for example). We show the entire calculation in full. You can track the result in your watchlist or portfolio and be alerted when this changes, or use our stock screener to discover 29 high quality undervalued stocks. If you save a screener we even alert you when new companies match - so you never miss a potential opportunity.
Next Steps
Feeling encouraged by the tone around Farmers & Merchants Bancorp so far, or slightly wary of the recent strength? Move quickly to review the data in detail and stress test your own thesis, then round out your work by checking the 3 key rewards.
Looking for more investment ideas beyond Farmers & Merchants Bancorp?
If Farmers & Merchants Bancorp has sharpened your focus on quality, do not stop here. Broaden your watchlist now or risk missing the next opportunity.
- Target resilient balance sheets by scanning a curated list of solid balance sheet and fundamentals (26 results) that filters for companies combining financial strength with durable fundamentals.
- Hunt for potential value gaps using the 29 high quality undervalued stocks and see which businesses currently trade at a discount to their financial quality.
- Lock in ideas for income-focused portfolios by reviewing a hand picked 6 dividend fortresses built around higher yield and stability.
Have feedback on this article? Concerned about the content? Get in touch with us directly. Alternatively, email editorial-team@simplywallst.com