
Marubeni (TSE:8002) At 14.1x P E Looks Cheap On Fresh Value Stock Calls
Fresh analyst commentary around Marubeni (TSE:8002) has highlighted the stock as a potential value opportunity, citing P/E, P/B, and P/S ratios below industry averages and an earnings outlook that has increased investor attention.
Recent trading reflects that renewed interest. Marubeni’s share price sits at ¥4,979, with an 11.94% year to date share price return. The 1 year total shareholder return of 35.01% and very large 5 year total shareholder return suggest longer term momentum has been strong, even though the 90 day share price return declined 7.28% as investors reassess risks and expectations around the valuation story.
Compare Marubeni’s value case with a curated set of peers by scanning 14 high quality undervalued stocks that share strong fundamentals and may also be priced for a potential rerating.
After a powerful multi year run and a recent pullback, Marubeni now sits at a point where the real question is simple. Do the current P/E, P/B and P/S still leave meaningful upside on the table, or has most of the reward already played out in the price?
Price-to-Earnings of 14.1x: Is it justified?
On the numbers given, Marubeni’s valuation picture splits in two. The SWS DCF model points to a future cash flow value of ¥4,312.98, which is below the last close at ¥4,979, while the current price to earnings ratio sits at 14.1x and is flagged as attractive against an estimated fair P/E of 21.4x.
P/E compares what you pay for each unit of earnings. For a conglomerate like Marubeni that earns income across commodities, infrastructure, finance and consumer goods, this single figure gives you a quick sense of how much investors are currently willing to pay for its profit stream.
On one side of the ledger, the stock is described as good value versus its own fair ratio, with the 14.1x P/E below an estimated 21.4x level that the market could move towards. On the other side, the same 14.1x multiple is labelled expensive against the broader JP Trade Distributors group on 10.6x. This means the market is currently assigning Marubeni a richer earnings tag than many direct peers.
That mixed picture filters down to the peer set as well. The 14.1x P/E is assessed as good value relative to a 15.5x peer average, implying the share trades at a lower earnings multiple than similar companies even after a strong multi year share price run.
Explore the SWS fair ratio for Marubeni.
Result: Price-to-Earnings of 14.1x (ABOUT RIGHT)
Still, two pressure points could flip the Marubeni story fast: a deeper 90 day share price pullback or weaker net income growth could quickly challenge today’s valuation case.
Find out about the key risks to this Marubeni narrative.
Another view on Marubeni’s value
The SWS DCF model tells a different story to the P/E work. On this framework, Marubeni’s estimated future cash flow value is ¥4,312.98 per share, below the current ¥4,979 price, which frames the stock as overvalued on this specific cash based lens. That gap raises a simple question for you: Which signal deserves more weight, earnings multiples or cash flow value?
Look into how the SWS DCF model arrives at its fair value.
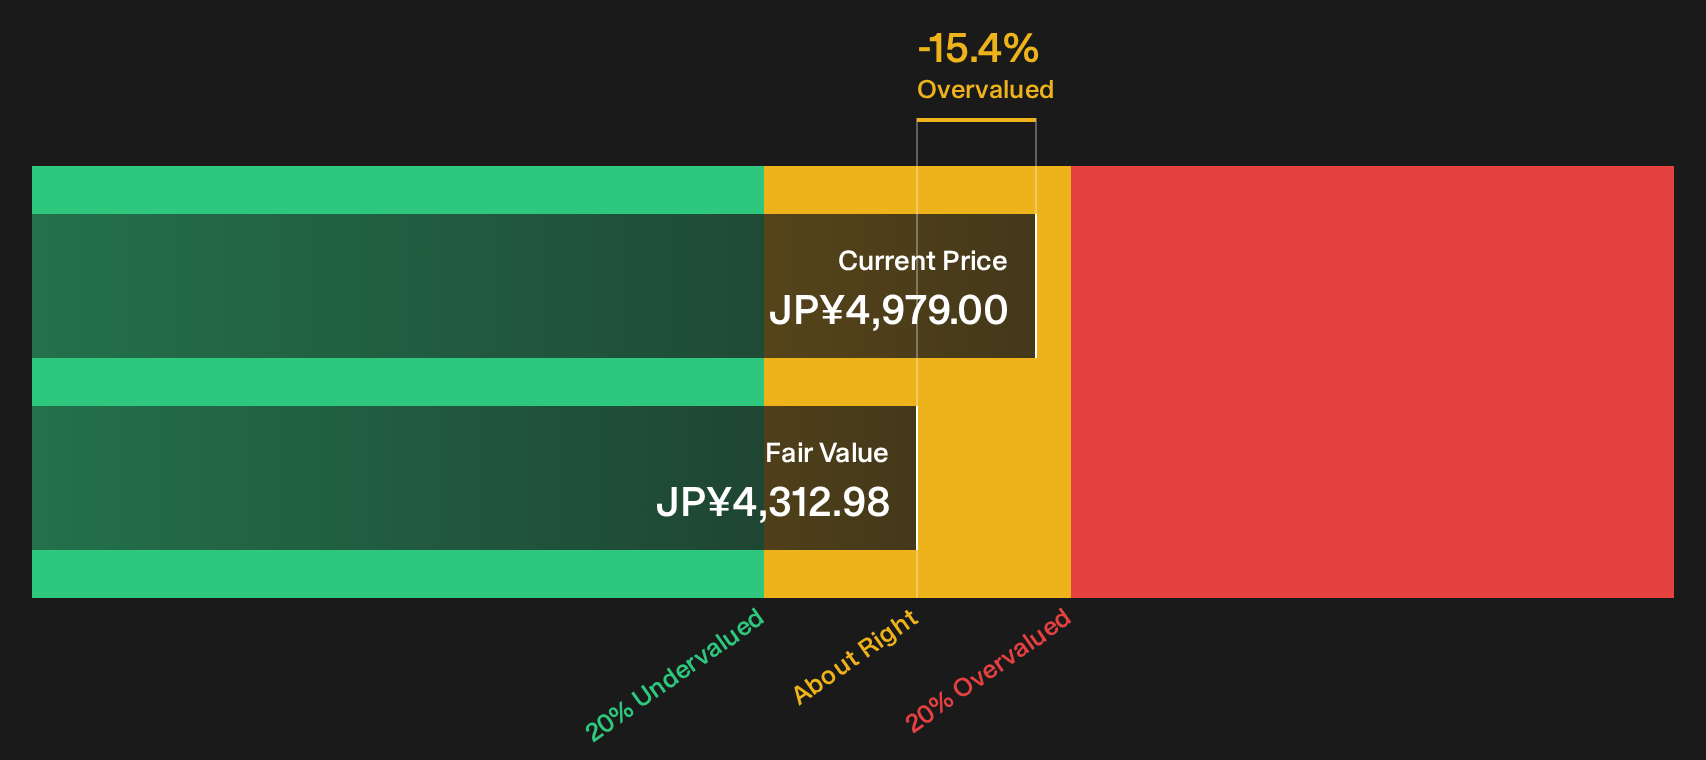
Simply Wall St performs a discounted cash flow (DCF) on every stock in the world every day (check out Marubeni for example). We show the entire calculation in full. You can track the result in your watchlist or portfolio and be alerted when this changes, or use our stock screener to discover 14 high quality undervalued stocks. If you save a screener we even alert you when new companies match - so you never miss a potential opportunity.
Next Steps
The debate around Marubeni’s current pricing cuts both ways, so use the data, weigh the mood and move fast to reach your own verdict. To see how the upside case stacks up against the concerns flagged so far, start by reviewing the following: 2 key rewards and 2 important warning signs
Looking for more investment ideas beyond Marubeni?
If the mixed signals on Marubeni have sharpened your thinking, now is the moment to widen your watchlist and pressure test new opportunities.
- Target durable compounding potential by scanning companies with strong cash positions and clean finances through the list of solid balance sheet and fundamentals (23 results).
- Hunt for quality on sale by reviewing the 14 high quality undervalued stocks that combine solid fundamentals with prices that may not fully reflect them.
- Strengthen your income playbook by checking a curated set of higher yield opportunities in the 29 dividend fortresses.
Have feedback on this article? Concerned about the content? Get in touch with us directly. Alternatively, email editorial-team@simplywallst.com