
Investor (OM:INVE A) Could Be 69% Undervalued Following Mixed Q3 Results
Investor (OM:INVE A) drew fresh attention on 16 October after reporting third quarter and nine month 2026 results, with higher sales and a mixed net income picture across the reporting periods.
At a share price of SEK406.3, Investor has delivered a 24.82% year to date share price return, while the 1 year total shareholder return of 30.92% and 3 year total shareholder return of 114.72% point to strong longer term momentum despite a softer 7 day share price pullback.
Scan how Investor compares across similar high conviction holdings by reviewing the hand picked 193 high quality undervalued stocks with resilient balance sheets and established earnings profiles.
Bulls point to Investor’s strong multi year share gains and nine month earnings, while bears lean on the softer latest quarter and rich history. Does today’s SEK406.3 price still leave meaningful upside on the table?
Preferred P/E of 5.8x: Is it justified?
On Simply Wall St metrics, Investor trades on a P/E of 5.8x at a last close of SEK406.3, which screens as inexpensive compared to both peers and the wider European diversified financial group.
The P/E multiple compares the current share price to earnings per share and gives a quick sense of how much investors are paying for each unit of profit. For an investment group like Investor with a long history, diversified holdings and meaningful exposure to listed companies, earnings can swing with markets, so this simple yardstick often becomes a key shorthand for sentiment around the whole portfolio.
Here, the 5.8x P/E sits below the European diversified financial industry average of 9.8x and also below the peer average of 11.9x. That gap indicates that the market is currently pricing Investor's earnings at a discount. When compared with an estimated fair P/E of 9.9x from the SWS fair ratio work, the current multiple is even further below the level the market might move toward if sentiment and fundamentals aligned with that benchmark.
Explore the SWS fair ratio for Investor.
Result: Price-to-earnings of 5.8x (UNDERVALUED)
Still, revenue and net income have each declined on an annual basis, and concentrated exposure to listed holdings means Investor’s reported earnings can vary depending on market conditions.
Find out about the key risks to this Investor narrative.
Another view using the SWS DCF model
The P/E points to value in Investor, yet the SWS DCF model paints an even starker picture. In that framework, the estimated future cash flow value is SEK1,274.06 per share, while the current price is SEK406.3. That gap suggests a wide margin between what the market pays today and what the model implies over time. The question is whether you place more weight on earnings-based markers or on long run cash flows in a cycle like this.
Look into how the SWS DCF model arrives at its fair value.
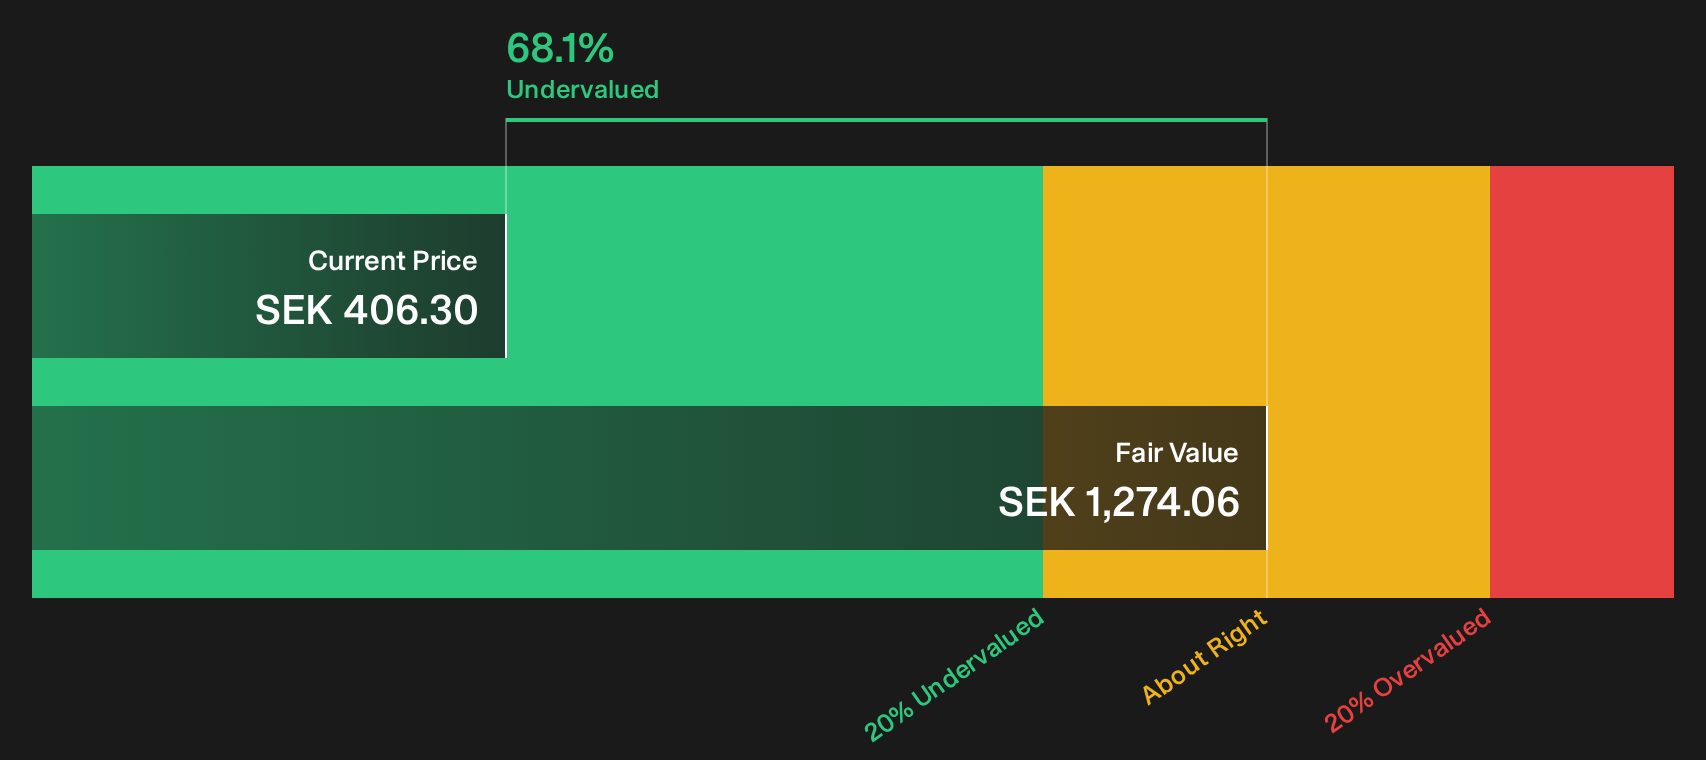
Simply Wall St performs a discounted cash flow (DCF) on every stock in the world every day (check out Investor for example). We show the entire calculation in full. You can track the result in your watchlist or portfolio and be alerted when this changes, or use our stock screener to discover 193 high quality undervalued stocks. If you save a screener we even alert you when new companies match - so you never miss a potential opportunity.
Next Steps
Mixed signals around valuation and recent earnings can pull you in both directions, so it makes sense to inspect the details yourself and decide quickly where you land. To weigh up both sides efficiently, start with the 3 key rewards and 1 important warning sign.
Looking for more investment ideas beyond Investor?
If Investor has sharpened your focus on value and quality, do not stop here. Broader idea hunting can help you build a more resilient portfolio.
- Target potential mispricing by scanning companies that combine quality metrics with appealing valuations through the 613 high quality undiscovered gems.
- Strengthen the foundation of your portfolio by reviewing a list of solid balance sheet and fundamentals (205 results) that can better handle tough conditions.
- Reduce portfolio stress by filtering for 221 resilient stocks with low risk scores that align with a more defensive approach.
Have feedback on this article? Concerned about the content? Get in touch with us directly. Alternatively, email editorial-team@simplywallst.com