
Toyota Motor (TSE:7203) Could Be 46% Overvalued After Its 4.6% Monthly Rebound
Toyota Motor (TSE:7203) has been drawing fresh attention after recent share price moves, with the stock closing at ¥3,127. Investors are weighing this against performance over the past month and past 3 months.
The recent 1 month share price return of 4.6% hints at rebuilding momentum for Toyota Motor, even as the year to date share price return is down 8%. Over a longer stretch, the 5 year total shareholder return of 76.64% shows how different the picture can look once dividends are included.
Scan how Toyota Motor stacks up against other global auto players by running the list of solid balance sheet and fundamentals (23 results) to find potential alternatives with similar resilience.
After a 4.6% one month rebound, Toyota Motor still trades about 15% below analyst targets, while a separate fair value model flags a premium. Is the market showing healthy caution, or mispricing the recovery story?
Most Popular Narrative: 46% Overvalued
The most followed narrative on Toyota Motor pegs fair value at ¥2,137.79, well below the recent close at ¥3,127. That gap is wide enough that the story hinges on whether the market is already paying up for a next chapter that is still being built.
Today, Toyota is not just an automobile manufacturer but an energy company holding the keys to future energy storage technologies. This makes it an essential asset for a balanced portfolio.
See why 6 investors see Toyota Motor as 46% overvalued.
Result: Fair Value of ¥2,137.79 (OVERVALUED)
Still, Toyota Motor faces narrative risk if solid state battery development disappoints, or if global EV policy and consumer uptake shift faster than its hybrid-heavy approach.
Find out about the key risks to this Toyota Motor narrative.
Another View On Toyota Motor’s Valuation
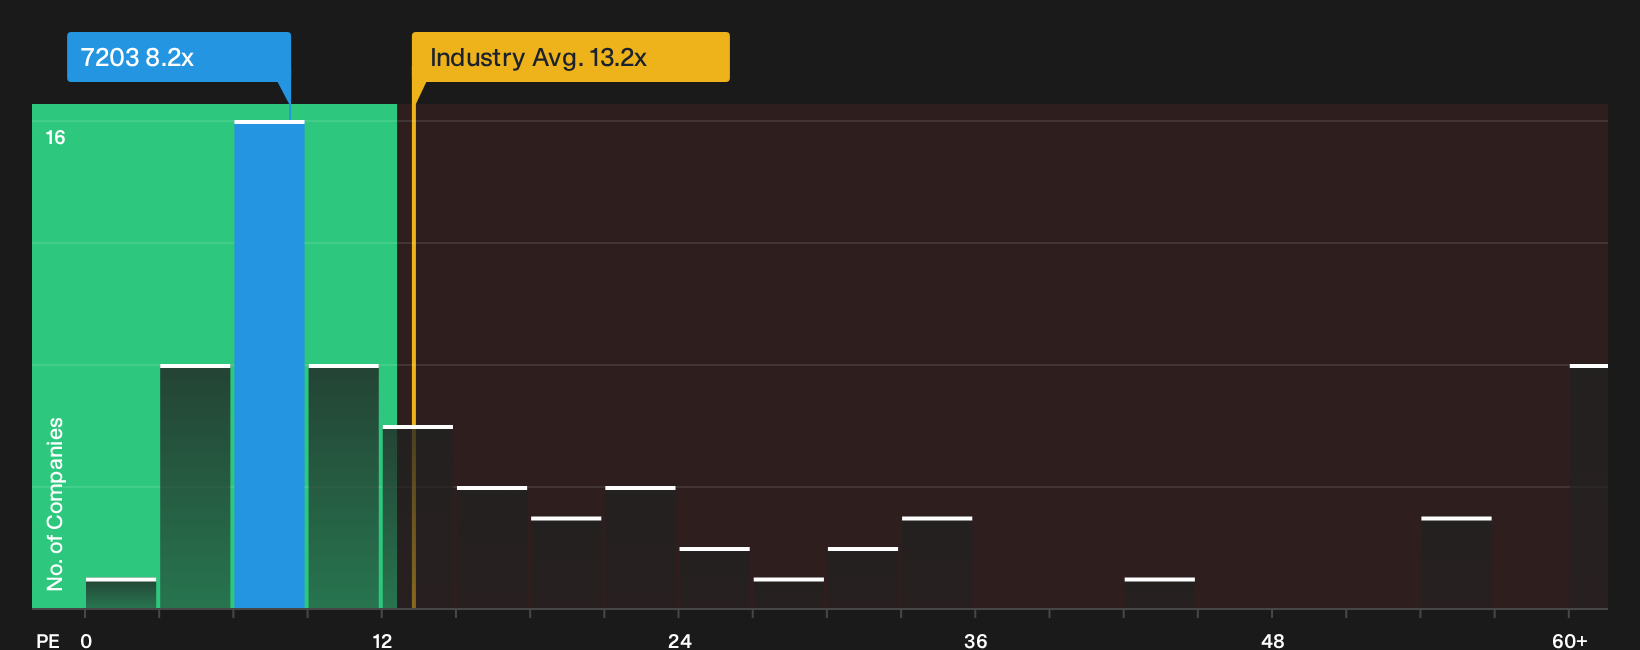
The first narrative pegs Toyota Motor at around ¥2,137.79, which points to a premium at today’s ¥3,127 price. The market ratio picture looks very different. On earnings of ¥4,483,797m, the stock trades on a P/E of 8.2x versus 13.2x for the Asian auto sector and 11.6x for peers, while the fair ratio sits higher again at 15.1x. That gap suggests the crowd narrative of 46% overvalued clashes with a market that still prices Toyota Motor below both its group and an earnings level the fair ratio hints the multiple could gravitate toward over time. So which story do you trust when sentiment and simple earnings math point in different directions?
To pressure test that earnings based view against more detailed cash flow work, it is worth looking at how the SWS P/E framework stacks up against peers and the fair ratio in the full valuation breakdown. Then consider whether the discount reflects caution or an opportunity before you act on either narrative. See what the numbers say about this price — find out in our valuation breakdown.
Next Steps
Mixed signals on Toyota Motor’s valuation can be unsettling, so act promptly, run the numbers yourself, and weigh both the upside and the risks with 3 key rewards and 2 important warning signs
Looking for more investment ideas beyond Toyota Motor?
If Toyota Motor has sharpened your focus on valuation and quality, do not stop here. Broaden your watchlist, pressure test your thinking, and give yourself more options.
- Target resilient opportunities with stronger balance sheets and solid fundamentals by scanning the list of solid balance sheet and fundamentals (23 results).
- Hunt for quality at a discount by reviewing the 14 high quality undervalued stocks that may align better with your risk and return expectations.
- Build a steadier income stream by assessing the 30 dividend fortresses that could complement a core position like Toyota Motor in your portfolio.
Have feedback on this article? Concerned about the content? Get in touch with us directly. Alternatively, email editorial-team@simplywallst.com