
11% Below Fair Value As Hawkins (HWKN) Puts Rich P E To The Test
Hawkins (HWKN) has drawn fresh attention after recent share performance data showed a mixed run, with gains over the past month but declines over the past 3 months and year to date.
At a share price of $132.32, Hawkins has seen short term momentum soften, with the 90 day share price return down 7.48% and the year to date share price return down 8.92%. However, the 3 year total shareholder return of 137.30% and 5 year total shareholder return of 280.46% still indicate a very strong longer term outcome.
Scan beyond Hawkins and line up its recent swings against a curated 28 high quality undervalued stocks that also combines solid cash generation with balance sheet strength.
Hawkins has the track record of a strong operator, yet the share price has cooled in the past year. So at around $132, are you paying up or getting a fair entry into that quality?
Price-to-Earnings of 34.3x: Is it justified?
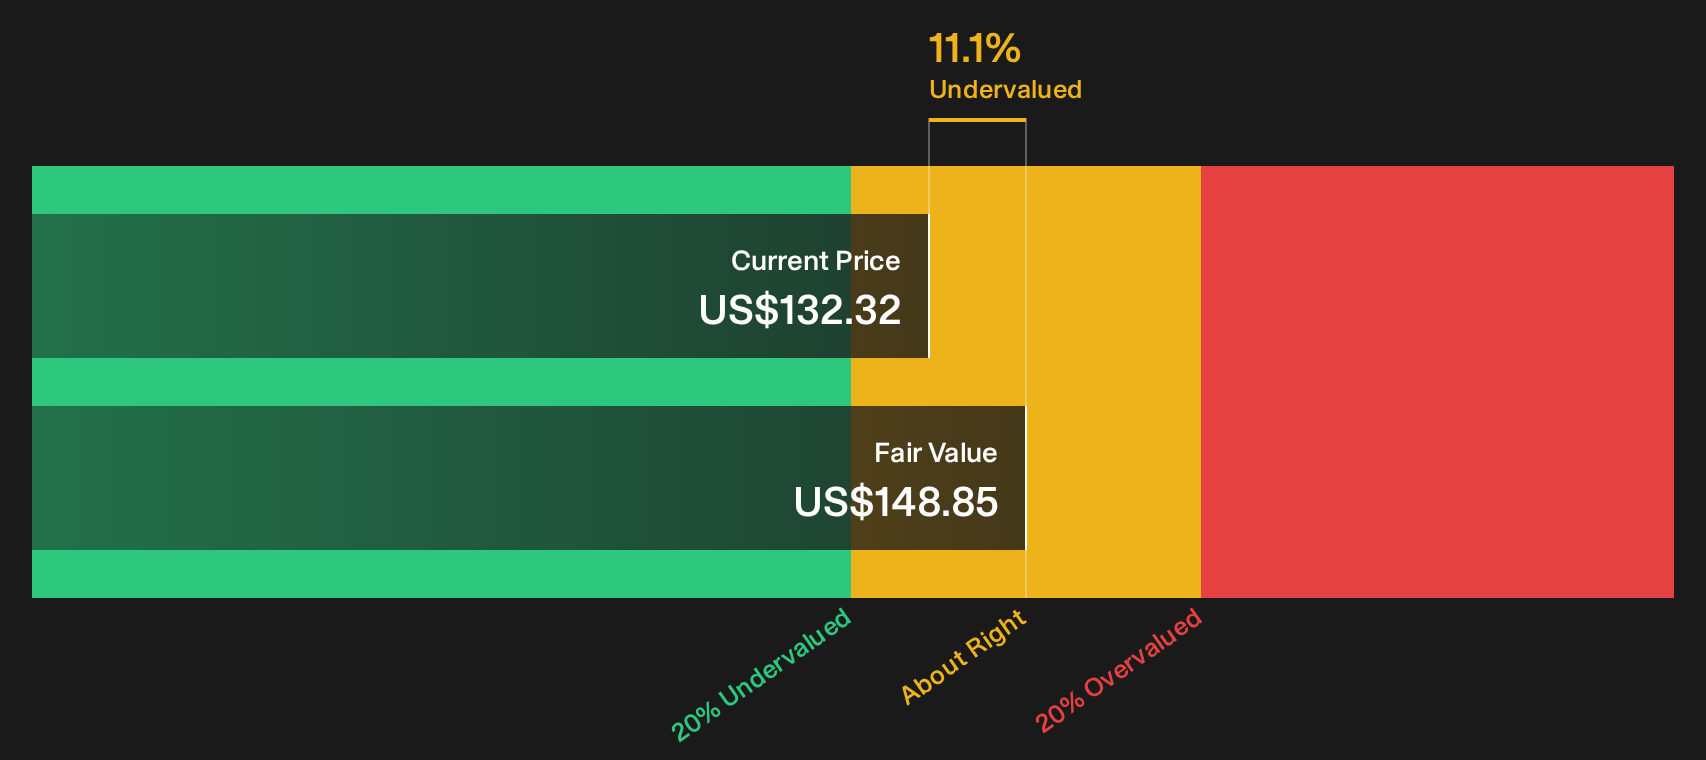
On simple valuation math, Hawkins does not look cheap. The stock trades on a P/E of 34.3x against the last close of $132.32, while our model-based fair value suggests the shares are trading at an 11.1% discount to intrinsic value.
The P/E ratio compares what you pay per share to the earnings that Hawkins generates per share. For a chemicals and ingredients supplier, that number reflects what investors are willing to pay today for each dollar of current profits, based on expectations about future cash flows, growth, and business resilience.
Here, the market is assigning Hawkins a materially richer P/E than both its direct peers and what our fair value work implies. The stock trades at 34.3x earnings compared with a peer average of 20.6x and a US Chemicals industry average of 22.1x. The estimated fair P/E of 17.8x indicates a level the valuation could move toward if sentiment cooled.
Explore the SWS fair ratio for Hawkins.
Result: Price-to-Earnings of 34.3x (OVERVALUED)
Still, the story can change quickly if Hawkins sees a sharper slowdown in revenue, or if the premium P/E multiple contracts as investor enthusiasm cools.
Find out about the key risks to this Hawkins narrative.
Another View: Hawkins Through A Cash Flow Lens
The P/E screen paints Hawkins as expensive, yet the SWS DCF model points the other way. In that framework, the current $132.32 price sits about 11.1% below an estimated fair value of $148.85, which frames today’s level as a possible entry point rather than pure froth. So which signal should carry more weight in your process?
Look into how the SWS DCF model arrives at its fair value.
Simply Wall St performs a discounted cash flow (DCF) on every stock in the world every day (check out Hawkins for example). We show the entire calculation in full. You can track the result in your watchlist or portfolio and be alerted when this changes, or use our stock screener to discover 28 high quality undervalued stocks. If you save a screener we even alert you when new companies match - so you never miss a potential opportunity.
Next Steps
Mixed signals on Hawkins can feel confusing. Move quickly, pull up the same data, and stress test it against your own approach with 3 key rewards and 1 important warning sign
Looking for more investment ideas beyond Hawkins?
If Hawkins has sharpened your thinking on valuation and quality, do not stop here. Broader idea hunting can help you spot opportunities you might otherwise miss.
- Target potential mispricings by scanning a 28 high quality undervalued stocks that filters for strong fundamentals paired with appealing valuations.
- Fortify your income watchlist with a 5 dividend fortresses that focuses on higher yield payers supported by underlying business strength.
- Prioritise resilience by using a 30 resilient stocks with low risk scores built around companies with sturdier financial profiles and lower risk scores.
Have feedback on this article? Concerned about the content? Get in touch with us directly. Alternatively, email editorial-team@simplywallst.com