
Is Bitcoin Heading for Another New Record High?
I asked if Bitcoin was going to trade above $100,000 per token on Barchart on September 11, 2026, when I concluded with the following:
With four months left in 2026, Bitcoin could reach and exceed $100,000 per token. From April through August 2025, Bitcoin rose nearly $50,000 per token. With the leading cryptocurrency close to $23,000 below the $100,000 level, a rally to that level is not out of the question, but time is running short.
Bitcoin was trading at $76,792.27 on September 11, and Coinbase (COIN), a leading cryptocurrency exchange, was $172.28 per share. On October 26, Bitcoin was just above $80,000, and COIN shares were around $161.
Bitcoin could be following a historical explosive pattern
Bitcoin isn’t running away on the upside, but the recovery from the July 2026 low could mark the start of another explosive rally.
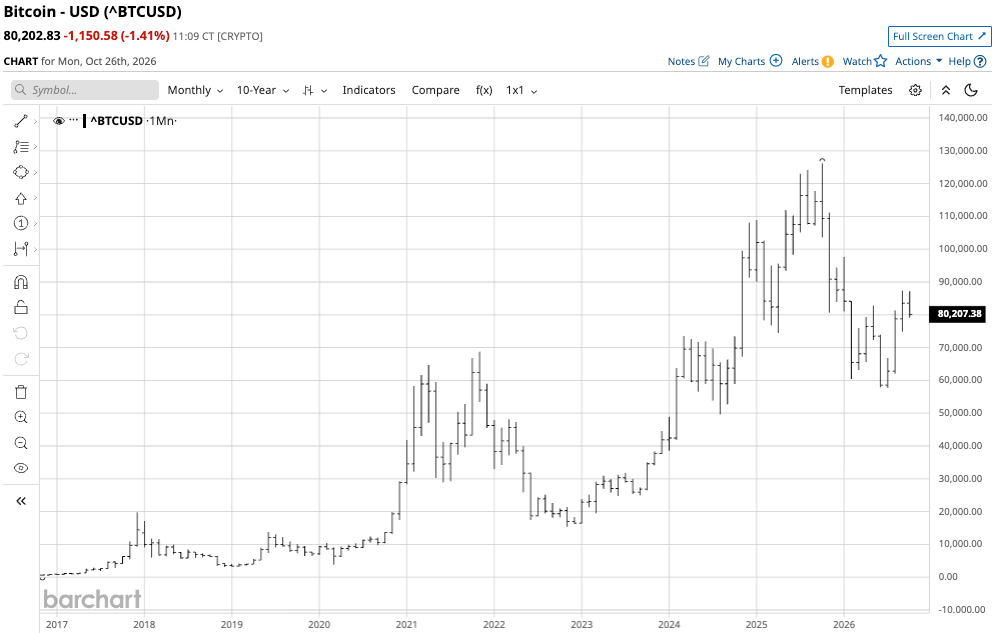
The monthly chart shows that Bitcoin has experienced explosive and implosive price behavior over the past years, but that the long-term pattern of higher lows and higher highs remains firmly intact.
Bitcoin is a highly volatile asset. If the July 2026 low was a bottom and the pattern holds, the leading cryptocurrency could head toward a higher high above the October 2025 high of $126,184.05 per token.
COIN tends to track Bitcoin
Over time, Coinbase Global (COIN) correlates well with Bitcoin’s price action.
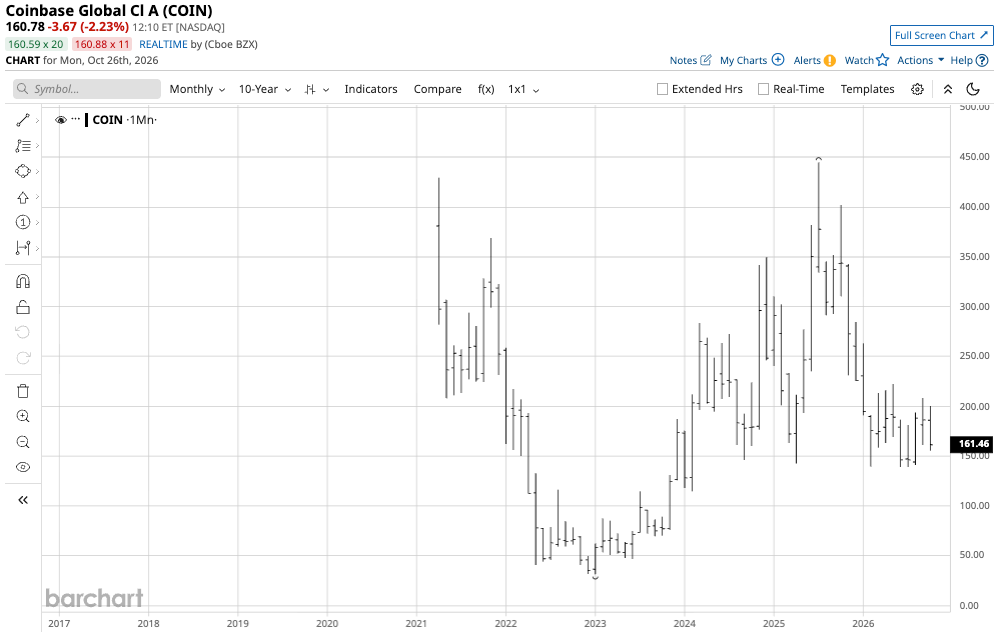
The monthly chart shows that COIN has experienced massive volatility since its April 2021 IPO, which opened at $381 per share. COIN has traded as low as $31.55 in January 2023, and as high as $444.64 per share in July 2025. While COIN does not track Bitcoin precisely, it does tend to move higher and lower with the leading cryptocurrency. Bitcoin now accounts for nearly 60% of the total cryptocurrency market cap. As the asset class leader, rising Bitcoin prices increase market activity, boosting COIN's revenue and earnings. During implosive price action, COIN’s business suffers. As a result, COIN’s financial results are as volatile as cryptocurrency prices.
Technical levels in Bitcoin and COIN
The year-to-date charts highlight the current support and resistance levels for Bitcoin and COIN.
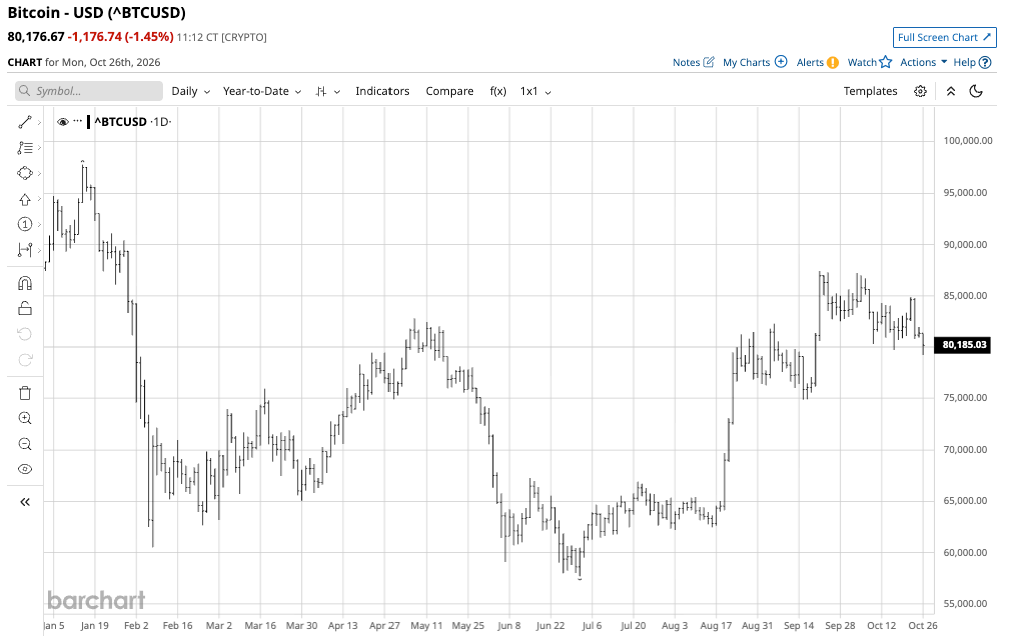
The daily chart shows that Bitcoin has traded between the July 1 low of $57,717.55 and the January 14 high of $97,764.04 in 2026. Current technical resistance sits at the September 21, 2026, high of $87,397 per token, a gateway to the January 14 high and the October 2025 all-time high of nearly $126,185 per token. Nearby technical support is at the September 15 low of $74,887.50 per token. Below that, the July low is the next downside target.
If the historical implosive and explosive pattern holds, Bitcoin offers a slightly better-than-1:1 risk-reward ratio at $80,200 per token based on its first technical support and resistance levels.
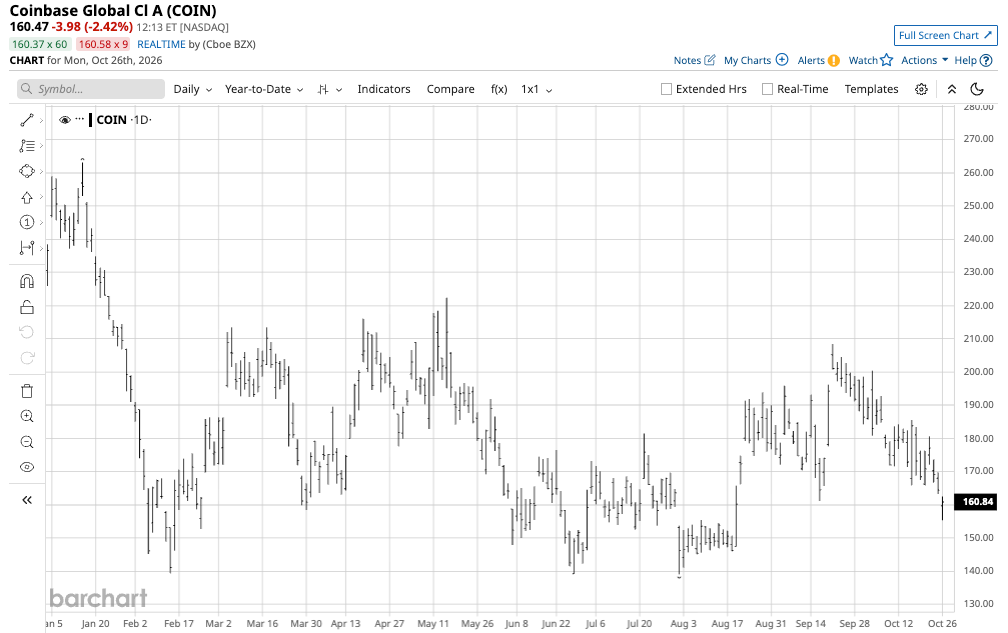
The daily chart shows that COIN has traded between the July 31 low of $139.11 and the January 14 high of $263.07 in 2026. Current technical resistance stands at the September 21, 2026, high of $208.33 per share. Above the late September high, technical resistance levels for COIN are at the May 14, 2026, high of $222.35, the January 14, 2026, high of $263.07, the December 9, 2025, high of $284.74, the October 2025 highs of $373.25 and $402.16, and the July 2025 record high of $444.64 per share.
Nearby technical support is at the July 31, 2026, low of $139.11 per share
COIN offers a better-than-1:2 risk-reward ratio at $161 per share, based on its first technical support and resistance levels.
Risk-reward is critical in cryptocurrencies and COIN
Risk is always a function of potential rewards. Assets like Bitcoin and COIN, with extremely high volatility, offer trading opportunities, but careful attention to risk-reward dynamics is crucial for success.
Any long or short position in the leading cryptocurrency or the cryptocurrency trading platform requires a plan, including stops and profit horizons that reflect a logical risk-reward balance, and favor rewards over risks. If price moves in the anticipated direction, it is acceptable to raise profit targets, but only by adjusting stop levels to protect profits and/or capital. If price moves contrary to expectations, stop levels protect capital and leave room for other trading opportunities. Explosive and implosive price action requires planning and discipline that increase the odds of success. Meanwhile, just because historical trading patterns and current price action favor higher prices, past performance does not guarantee future performance.
The odds of Bitcoin being above $100,000 are rising. How high can COIN rise?
Bitcoin’s path of least resistance will likely pull the correlated COIN share price along. With a little over two months until the end of 2026, the odds of Bitcoin reaching $100,000 are declining. From the current level, Bitcoin would have to rally around $20,000 per token to reach that level. While $20,000 is about 25% of the current price, Bitcoin has plenty of examples of moving more than $20,000 over a two-month period.
I am cautiously bullish on Bitcoin at the current price levels, but the potential for extreme volatility remains high. A risk-off period in markets could send prices lower, but a continuation of the current trend since the recent lows could lead to another in a long series of explosive rallies. A plan that includes tight stops, favorable risk-reward dynamics, and the understanding that accepting small losses in pursuit of significant gains could be optimal over the coming weeks and months.
On the date of publication, Andrew Hecht did not have (either directly or indirectly) positions in any of the securities mentioned in this article. All information and data in this article is solely for informational purposes. For more information please view the Barchart Disclosure Policy here.