
F5 (NASDAQ:FFIV) beats Q3 CY2026 sales expectations but stock drops

Application security provider F5 (NASDAQ:FFIV) announced better-than-expected revenue in calendar Q3 2026 (fiscal Q4 2026), with revenue up 13.3% year on year to $917.4 million. Guidance for next quarter’s revenue was better than expected at $885 million at the midpoint, 0.7% above analysts’ consensus estimates. Its non-GAAP profit of $4.42 per share was 3.9% above analysts’ consensus estimates.
For more on F5, read our free full research report.
F5 (FFIV) Q3 CY2026 highlights:
- Revenue $917.4 million vs S&P analysts’ consensus estimates of $885.3 million (13.3% year-on-year growth, 3.6% beat)
- Adjusted EPS $4.42 vs S&P analysts’ consensus estimates of $4.26 (3.9% beat)
- Adjusted operating income $309 million vs analysts’ consensus estimates of $300.9 million (33.7% margin, 2.7% beat)
- Revenue guidance $885 million at the midpoint for Q4 CY2026, roughly in line with what analysts were expecting
- Adjusted EPS guidance $18.15 at the midpoint for fiscal 2027, in line with analysts’ consensus estimates
- Operating margin 23.1%, down from 25.4% in the same quarter last year
- Free cash flow margin 9.9%, down from 32.4% in the previous quarter
- Billings $929.2 million at quarter end, up 9% year on year
- Market capitalization $26.14 billion
“Q4 closed out an exceptional fiscal year. In the quarter, we delivered 23% product revenue growth driving 13% total revenue growth year over year. Nine consecutive quarters of double-digit product revenue growth reflect F5’s expanding strategic role as our customers navigate hybrid multicloud complexity, an intensifying threat landscape, and a rapidly evolving AI-driven world,” said François Locoh-Donou, F5’s Chairman, President and CEO.
Revenue growth
Examining a company’s long-term performance can provide clues about its quality. Even a weak business can perform well for one or two quarters, but a high-quality one grows for years. F5’s revenue grew at a weak 5.6% annualized rate over the last five years, falling short of the software sector standard.
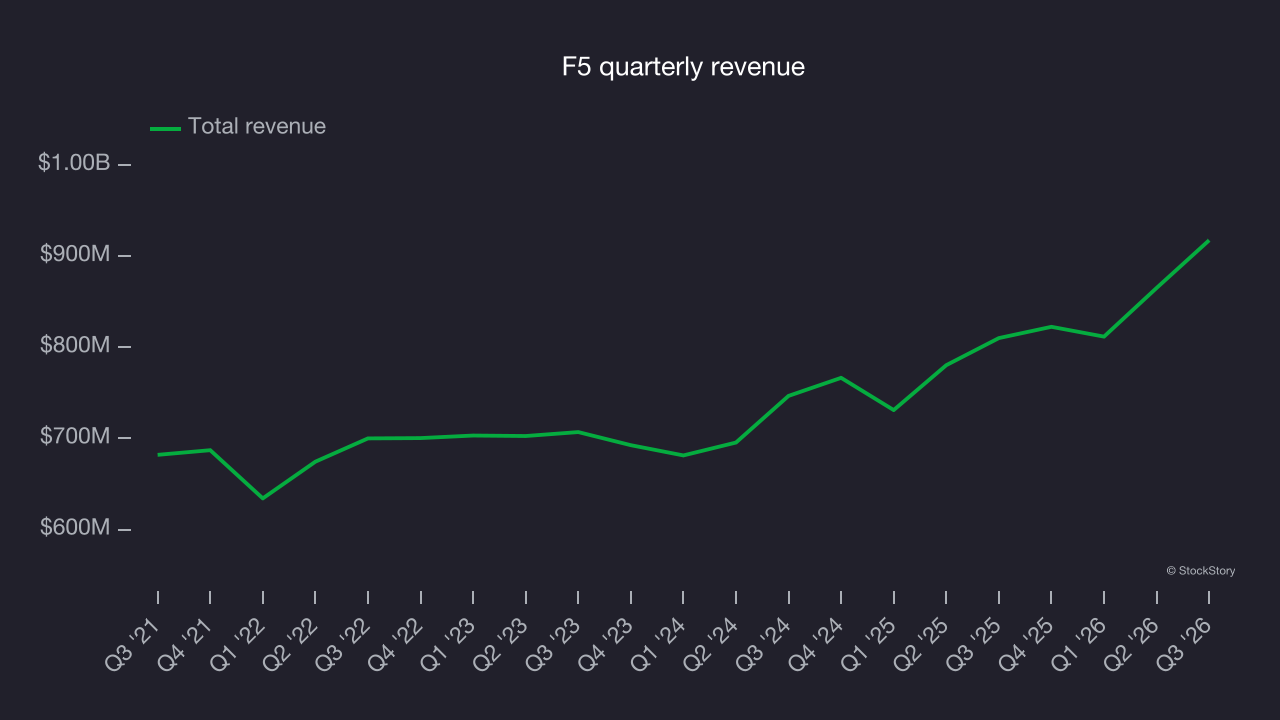
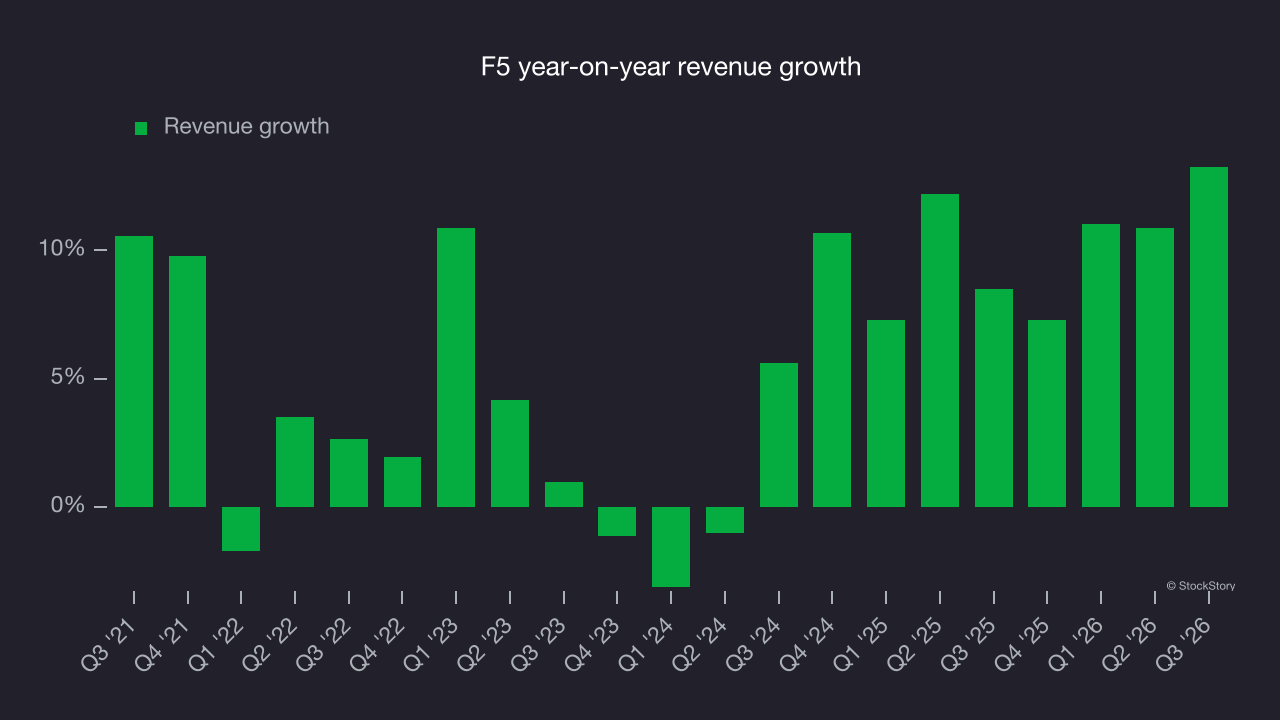
This quarter, F5 reported year-on-year revenue growth of 13.3%, and its $917.4 million of revenue exceeded Wall Street’s consensus estimates by 3.6%. Company management is currently guiding for a 7.6% year-on-year increase in revenue next quarter.
Looking further ahead, sell-side analysts expect revenue to grow 6.3% over the next 12 months, according to S&P, a deceleration versus the last two years. That outlook is uninspiring and indicates its products and services will see some demand headwinds.
Billings
Billings is a non-GAAP metric that is often called “cash revenue” because it shows how much money the company has collected from customers in a certain period. This is different from revenue, which must be recognized in pieces over the length of a contract.
F5’s billings came in at $929.2 million in Q3, and over the last four quarters, its growth was underwhelming as it averaged 10.9% year-on-year increases. This growth mirrored its overall revenue growth and suggests that increasing competition is making it harder to acquire and retain customers.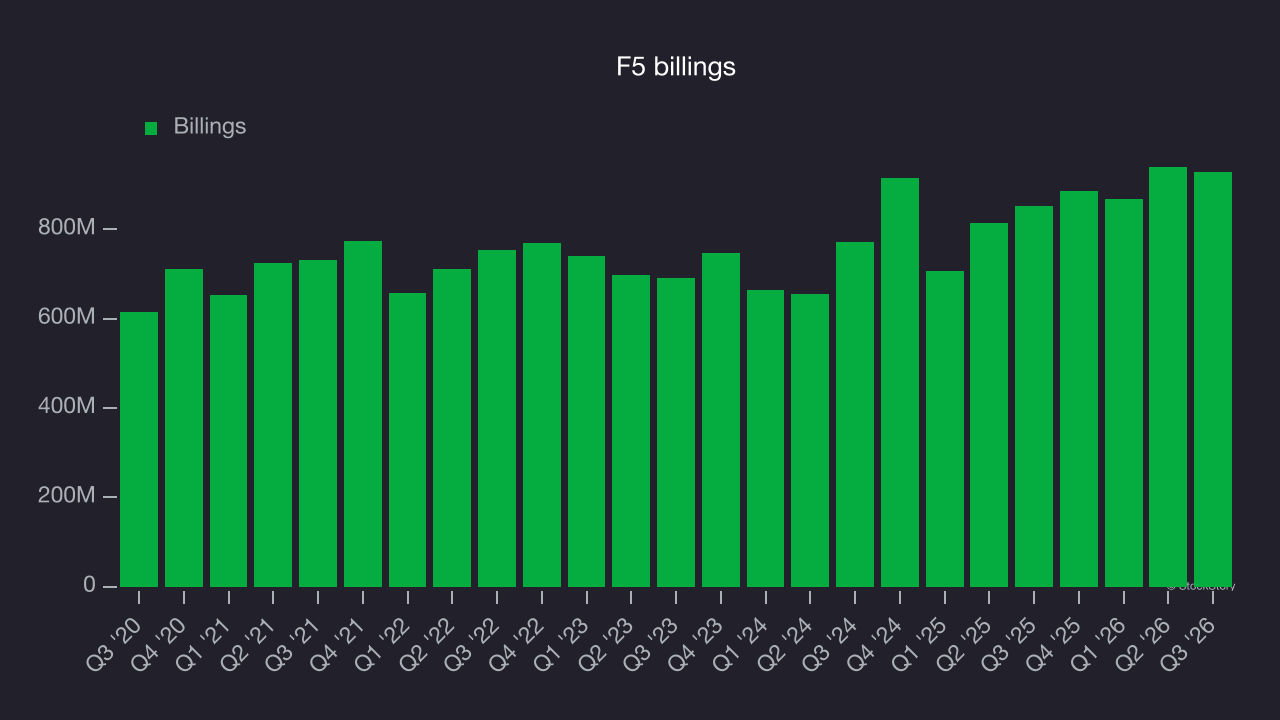
Customer acquisition efficiency
The customer acquisition cost (CAC) payback period represents the months required to recover the cost of acquiring a new customer. Essentially, it’s the break-even point for sales and marketing investments. A shorter CAC payback period is ideal, as it implies better returns on investment and business scalability.
F5 is highly efficient at acquiring new customers, with a CAC payback period of 5.1 months this quarter. The company’s rapid recovery of its customer acquisition costs means it can attempt to spur growth by increasing its sales and marketing investments.
Key takeaways from F5’s Q3 results
We enjoyed seeing F5 beat analysts’ billings expectations this quarter. We were also happy its revenue outperformed Wall Street’s estimates. On the other hand, its EPS guidance for next quarter slightly missed. Overall, this print was mixed. The market seemed to be hoping for more, and the stock traded down 5.1% to $436.91 immediately following the results.When evaluating F5 at its current price, consider valuation, business quality and the latest earnings. For more on those factors, read the full research report here (it’s free).