
Union Tool (TSE:6278) Expands Capacity Plans, Is The Stock Still Below Fair Value?
Union Tool (TSE:6278) has put capacity expansion back in focus after its board approved construction of the Mitsuke No. 4 Factory and began groundwork for a new production site in Niigata Prefecture.
For investors watching the tape, Union Tool’s 7.55% 1 day share price gain to ¥13,390 comes after a 7.34% decline over the past month. Total shareholder return of 72.58% over one year and very large three year gains suggest longer term momentum has still been strong even as shorter term sentiment has cooled.
Scan a curated group of industrials pursuing capacity builds similar to Union Tool’s latest move by running the list of solid balance sheet and fundamentals (23 results) as a starting universe for deeper research.
Capacity projects of this size can tempt you to chase Union Tool after a strong run or to sit back and wait for a cheaper entry. The valuation work now needs to show which instinct carries more weight.
Union Tool valuation: high P/E, deep DCF discount
Union Tool carries a rich P/E tag while the SWS DCF model points to a much higher cash flow value than the current share price.
The DCF output suggests a fair value of ¥39,092.38 per share compared with the latest close at ¥13,390. On that basis the stock trades at a large discount to this cash flow estimate.
The SWS DCF model works by projecting Union Tool’s future cash flows and discounting them back to today using an appropriate rate, then summing those present values into a single per share figure. It treats the current ¥13,390 price as what the market is willing to pay for those future streams and compares that to the modelled cash flow claim.
For a manufacturer with forecast revenue growth of 23.4% a year and expected earnings expansion of 27.5% annually, a cash flow approach directly links that growth path to value instead of relying on simple earnings multiples. The result is a framework that lets you judge whether the current discount lines up with Union Tool’s high quality earnings, 18.8% net margin and history of 14.5% yearly profit growth over five years.
Look into how the SWS DCF model arrives at its fair value.
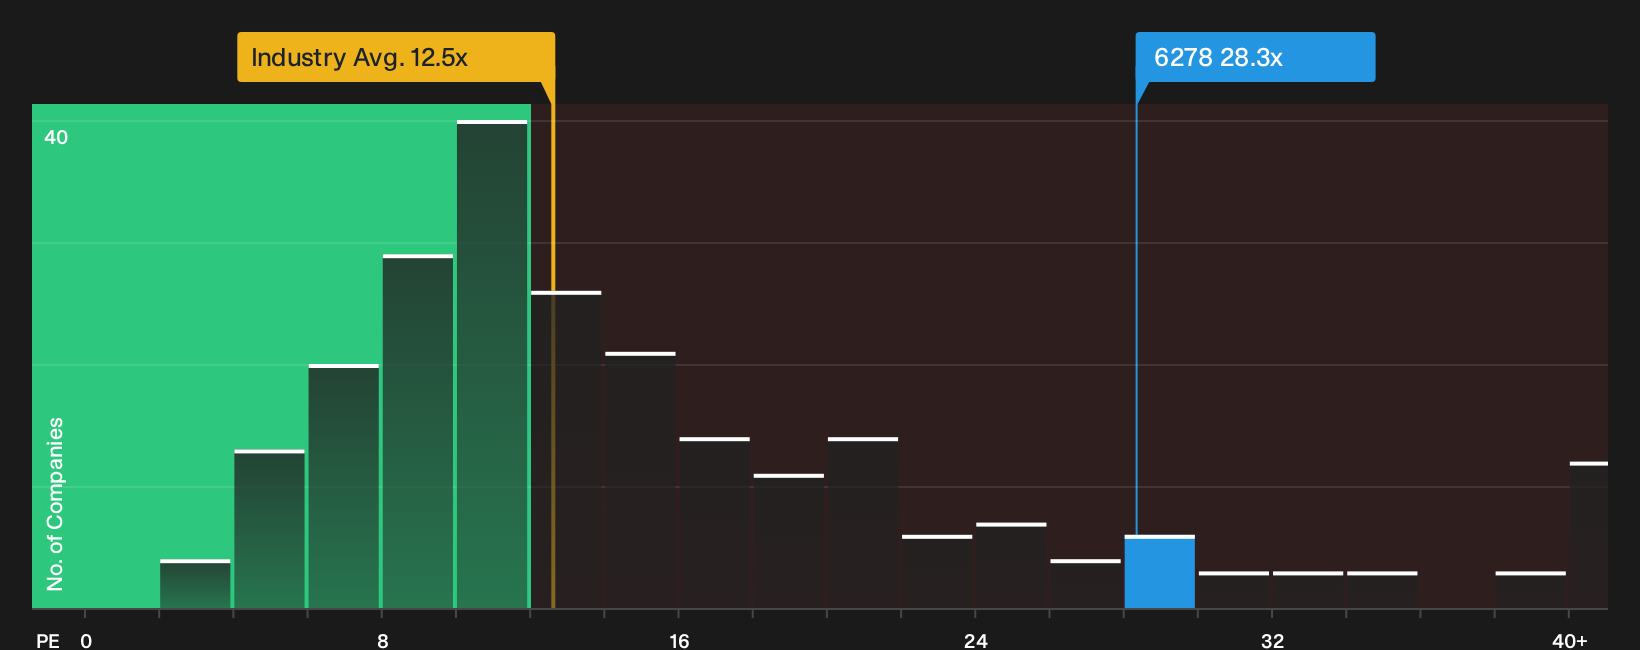
On the flip side, the market is not applying a low headline multiple. Union Tool trades on a P/E of 28.3x compared with 12.5x for the wider JP Machinery industry and 11.7x for its peer group.
P/E compares the share price to earnings per share. It tells you how many years of current profits buyers are willing to pay for upfront. For a toolmaker with global exposure, a higher figure usually reflects investor expectations for stronger earnings progress or confidence in the durability of profits.
Union Tool’s current P/E sits materially above both the industry and peer averages, which shows traders are willing to pay more for each yen of earnings than they are for most Machinery names. At the same time, an estimated fair P/E of 30.8x is slightly above the current 28.3x. That gap signals the multiple could shift closer to that fair level if the market keeps pricing the company in line with the model’s assumptions.
Explore the SWS fair ratio for Union Tool.
Result: Price-to-earnings of 28.3x (ABOUT RIGHT)
Still, the Union Tool story could be knocked off course if demand for PCB tooling weakens or if fresh capacity in Niigata ramps up more slowly than planned.
Find out about the key risks to this Union Tool narrative.
Another view on Union Tool’s valuation
That rich P/E for Union Tool sends a very different signal. At 28.3x earnings, the stock trades at more than double the JP Machinery sector on 12.5x and well above peers on 11.7x, even though the fair ratio sits only a touch higher at 30.8x.
A market that already prices in a premium against both the wider industry and similar companies, while also hovering just under the fair ratio, can leave less room for error if growth cools or margins slip. How much of the future story do you think is already baked into that multiple?
See what the numbers say about this price — find out in our valuation breakdown.
Simply Wall St performs a discounted cash flow (DCF) on every stock in the world every day (check out Union Tool for example). We show the entire calculation in full. You can track the result in your watchlist or portfolio and be alerted when this changes, or use our stock screener to discover 16 high quality undervalued stocks. If you save a screener we even alert you when new companies match - so you never miss a potential opportunity.
Next Steps
With Union Tool drawing both enthusiasm and caution, use the numbers as a prompt rather than a script and pressure test the story yourself by weighing the 3 key rewards and 1 important warning sign.
Looking for more Union Tool style investment ideas?
If Union Tool has sharpened your curiosity, do not stop here. Fresh opportunities rarely wait around and a wider watchlist gives you more options.
- Target potential mispricings by scanning companies that appear cheap against their fundamentals through the 16 high quality undervalued stocks.
- Prioritise resilience and downside protection by reviewing resilient stocks with lower risk profiles using the 22 resilient stocks with low risk scores.
- Spot underfollowed opportunities by checking companies with strong financial foundations in the 72 high quality undiscovered gems.
Have feedback on this article? Concerned about the content? Get in touch with us directly. Alternatively, email editorial-team@simplywallst.com