
3 Promising Asian Penny Stocks With Over US$400M Market Cap
Amidst a backdrop of global market volatility driven by AI investment concerns and rising oil prices, Asian markets have been navigating these challenges with resilience. Penny stocks, often seen as relics from past trading days, remain relevant for investors seeking growth potential in smaller or newer companies. When backed by solid financials, these stocks can uncover hidden value and offer significant opportunities for those willing to explore beyond the mainstream market.
Let's review some notable picks from our screened stocks.
China Oriental Group (SEHK:581)
Simply Wall St Financial Health Rating: ★★★★★☆
Overview: China Oriental Group Company Limited manufactures and sells iron and steel products for downstream steel manufacturers in the People’s Republic of China, with a market cap of approximately HK$3.46 billion.
Operations: The company's revenue is primarily derived from its Iron and Steel segment, which generated CN¥38.70 billion, complemented by its Real Estate segment with CN¥69.84 million.
Market Cap: HK$3.46B
China Oriental Group, with a market cap of HK$3.46 billion, primarily generates revenue from its Iron and Steel segment. Despite a recent earnings increase to CN¥241.23 million for the half-year ending June 2026, the company's growth lags behind industry standards and faces challenges such as high debt levels not well-covered by operating cash flow. Recent agreements with NEMM Upstream JV could offer new revenue streams through business support and leasing services. The seasoned management team provides stability; however, dividend sustainability remains questionable due to insufficient free cash flow coverage despite stable profit margins.
- Take a closer look at China Oriental Group's potential here in our financial health report.
- Learn about China Oriental Group's historical performance here.
Inner Mongolia Junzheng Energy & Chemical GroupLtd (SHSE:601216)
Simply Wall St Financial Health Rating: ★★★★★☆
Overview: Inner Mongolia Junzheng Energy & Chemical Group Co., Ltd. operates in the energy and chemical sectors, with a market capitalization of approximately CN¥39.66 billion.
Operations: Inner Mongolia Junzheng Energy & Chemical Group Co., Ltd. has not reported specific revenue segments.
Market Cap: CN¥39.66B
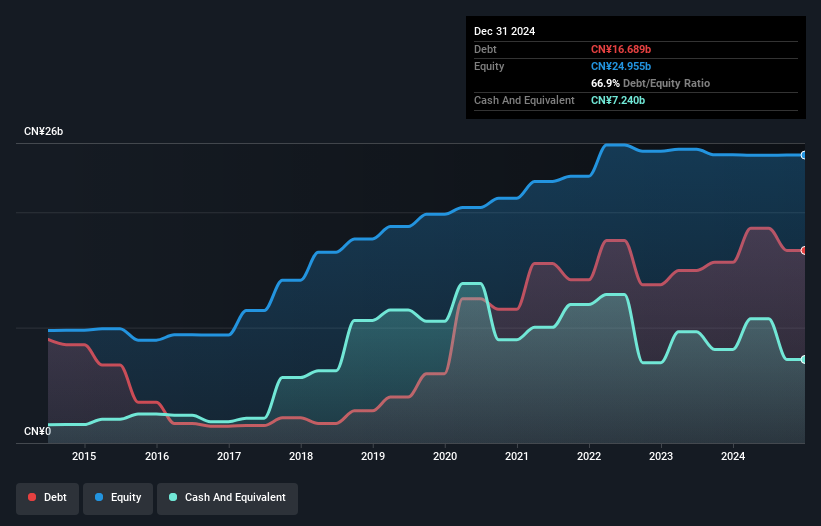
Inner Mongolia Junzheng Energy & Chemical Group Ltd., with a market cap of CN¥39.66 billion, shows a mixed financial landscape. The company has seen declining earnings over the past five years, with recent half-year net income dropping to CN¥1.67 billion from CN¥1.92 billion year-over-year. Despite high-quality earnings and a debt level well-covered by operating cash flow (120.1%), its short-term assets fall short of covering liabilities (CN¥10.9B vs CN¥11.1B). The board and management team lack experience, potentially affecting strategic direction, while the dividend yield of 8.09% isn't fully supported by earnings, raising sustainability concerns.
- Navigate through the intricacies of Inner Mongolia Junzheng Energy & Chemical GroupLtd with our comprehensive balance sheet health report here.
- Understand Inner Mongolia Junzheng Energy & Chemical GroupLtd's track record by examining our performance history report.
Guangdong Chant Group (SZSE:002616)
Simply Wall St Financial Health Rating: ★★★★★☆
Overview: Guangdong Chant Group Inc. operates in the environmental thermal energy sector primarily in China, with a market capitalization of CN¥4.16 billion.
Operations: Guangdong Chant Group Inc. has not reported specific revenue segments.
Market Cap: CN¥4.16B
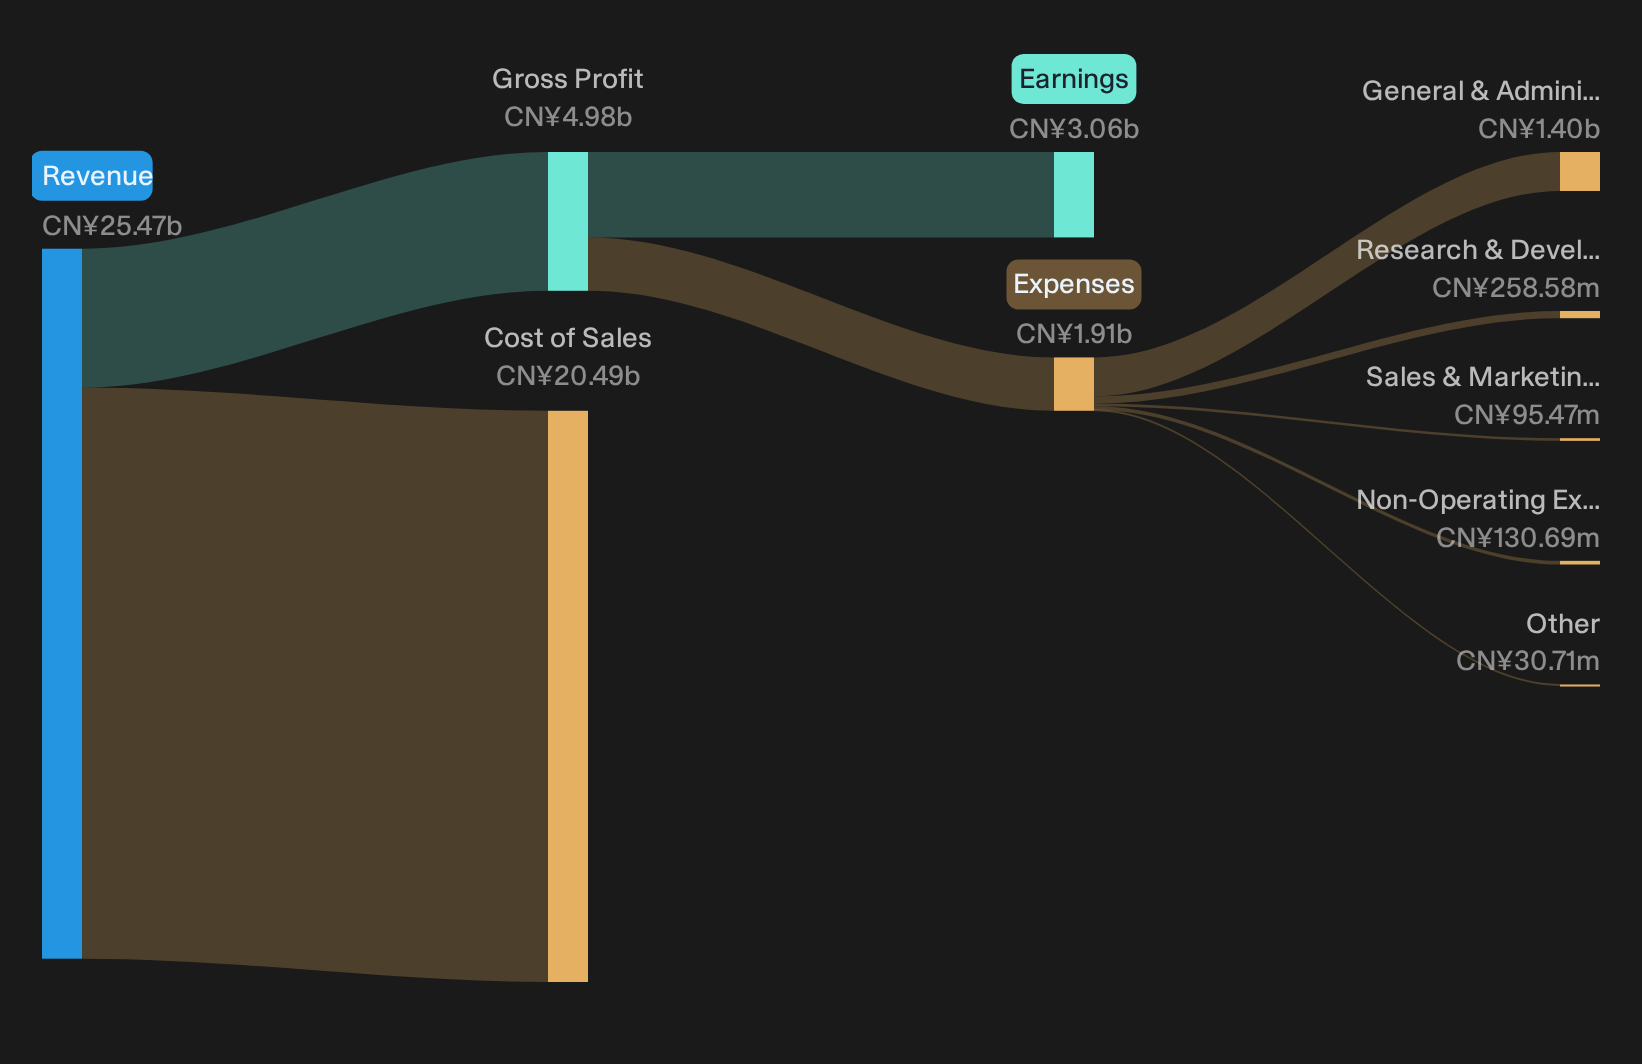
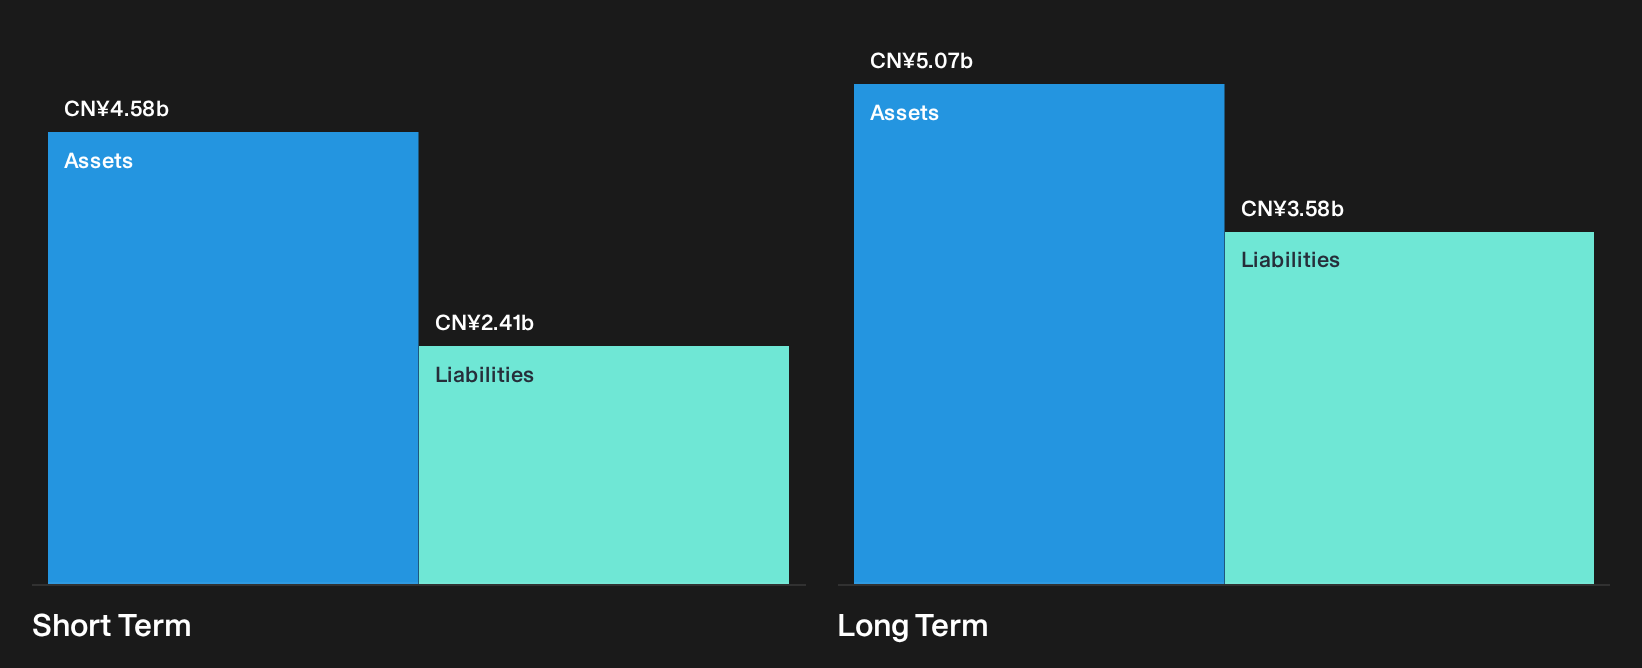
Guangdong Chant Group Inc., with a market cap of CN¥4.16 billion, operates in the environmental thermal energy sector and presents a mixed investment profile. The company shows stable weekly volatility and boasts an experienced board with an average tenure of 19 years. Its short-term assets (CN¥4.6 billion) exceed both short- and long-term liabilities, indicating financial stability despite a high net debt to equity ratio of 93.8%. Recent earnings reports revealed net income growth from CN¥201.7 million to CN¥251.1 million year-over-year, although revenue slightly declined from CNY 2,722.87 million to CNY 2,665.55 million for the same period.
- Dive into the specifics of Guangdong Chant Group here with our thorough balance sheet health report.
- Explore Guangdong Chant Group's analyst forecasts in our growth report.
Key Takeaways
- Embark on your investment journey to our 1,088 Asian Penny Stocks selection here.
- Ready To Venture Into Other Investment Styles? The best AI stocks today may lie beyond giants like Nvidia and Microsoft. Find the next big opportunity with these 20 smaller AI-focused companies with strong growth potential through early-stage innovation in machine learning, automation, and data intelligence that could fund your retirement.
This article by Simply Wall St is general in nature. We provide commentary based on historical data and analyst forecasts only using an unbiased methodology and our articles are not intended to be financial advice. It does not constitute a recommendation to buy or sell any stock, and does not take account of your objectives, or your financial situation. We aim to bring you long-term focused analysis driven by fundamental data. Note that our analysis may not factor in the latest price-sensitive company announcements or qualitative material. Simply Wall St has no position in any stocks mentioned.
Have feedback on this article? Concerned about the content? Get in touch with us directly. Alternatively, email editorial-team@simplywallst.com