
Is Dave (DAVE) Cheap As Analyst Optimism Builds Ahead Of Earnings?
Fresh optimism around Dave (DAVE) is building after recent analyst reports highlighted more upbeat earnings expectations and higher EPS estimates ahead of the company’s upcoming quarterly results, which are drawing closer attention from investors.
Recent trading has been choppy for Dave, with the share price slipping 14.35% over the past week and 14.55% over the past three months, even though the year to date share price return is 47.02% and the 3 year total shareholder return is over 60x, indicating strong long term performance while short term sentiment cools ahead of the earnings release.
Scan how this setup around Dave compares with other fast-moving financials by reviewing our hand-picked 19 high quality undiscovered gems on Simply Wall St.
With Dave still up sharply this year but pulling back into earnings, the question now is whether the current price fairly reflects that optimism or leaves more room for upside risk and reward.
Most Popular Narrative: 27% Undervalued
Against Dave’s last close at $322.69, the most followed narrative points to a fair value of $444.21, which suggests that current earnings expectations are still not fully reflected in the share price.
Ongoing advances in CashAI, with v5.5 associated with record-low loss metrics and v6 built on more than 700 features and already supporting higher credit limits at similar loss ranges, point to a scalable credit engine that can support higher ExtraCash originations and gross profit while helping protect net margins.
See why 46 investors see Dave as 27% undervalued.
Result: Fair Value of $444.21 (UNDERVALUED)
Still, this upbeat Dave story leans heavily on CashAI and off balance sheet funding, while the unresolved DOJ matter hangs over its fee model and product terms.
Find out about the key risks to this Dave narrative.
Another View On Dave’s Valuation
The 27% undervaluation story around Dave leans on analyst earnings forecasts and fair value estimates. A different lens, the Simply Wall St DCF model, points to a future cash flow value of $278.34 against a share price of $322.69, which screens as overvalued on this method. Which framework do you trust more for your own thesis?
To unpack what sits inside that cash flow view and how sensitive it is to the inputs, Look into how the SWS DCF model arrives at its fair value.
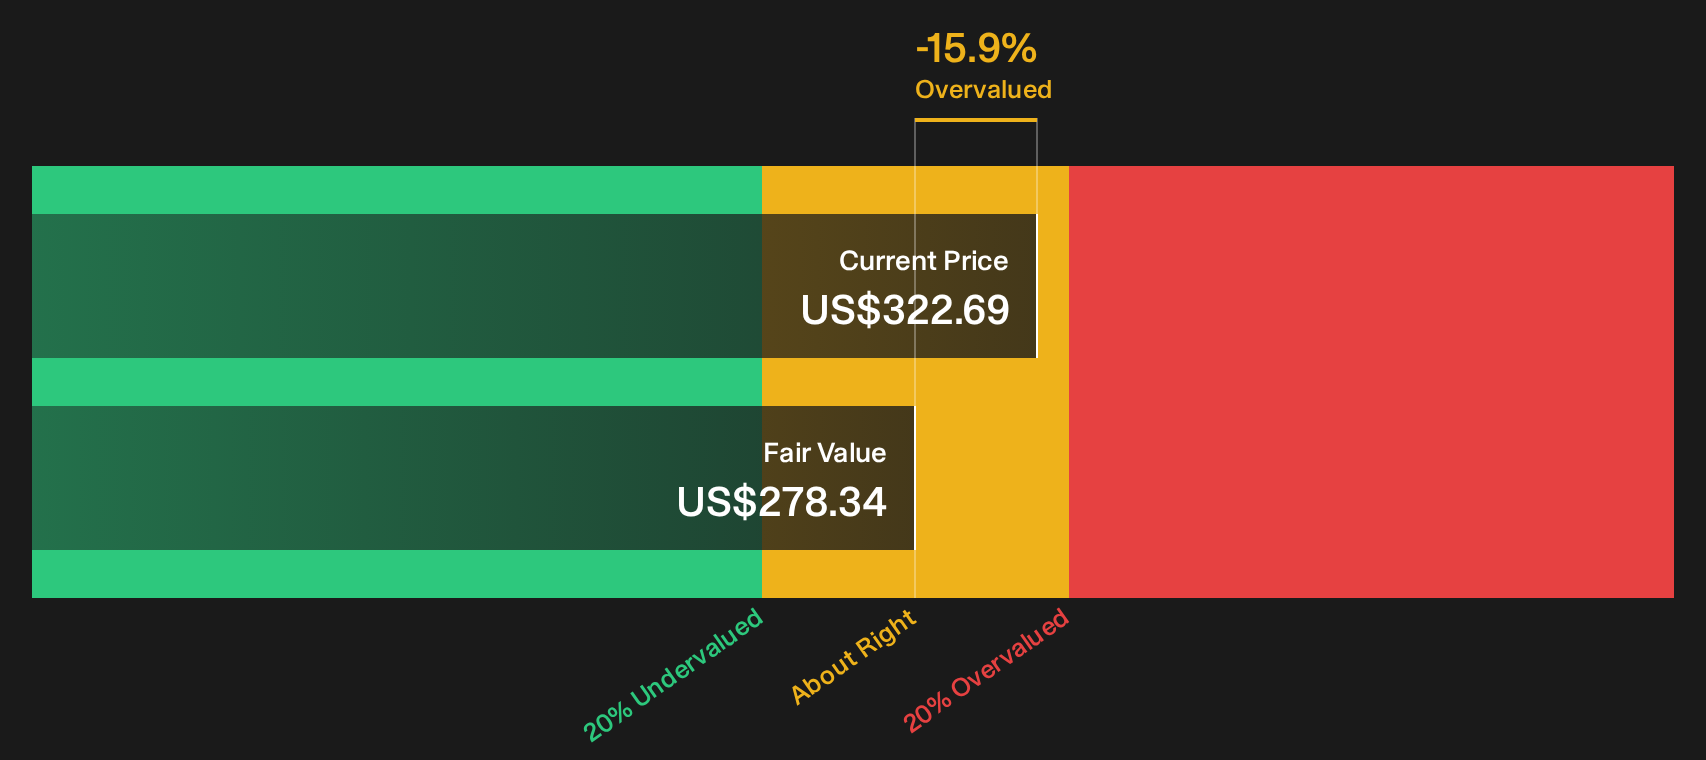
Simply Wall St performs a discounted cash flow (DCF) on every stock in the world every day (check out Dave for example). We show the entire calculation in full. You can track the result in your watchlist or portfolio and be alerted when this changes, or use our stock screener to discover 26 high quality undervalued stocks. If you save a screener we even alert you when new companies match - so you never miss a potential opportunity.
Next Steps
Sentiment around Dave is mixed, with both clear risk flags and appealing upside drivers. Move quickly, review the underlying data, and weigh the 3 key rewards and 1 important warning sign.
Hunting For Your Next Idea Beyond Dave?
If you stop with Dave, you only see one angle. Broaden your watchlist and you might spot opportunities others leave on the table.
- Target steadier opportunities by reviewing a 32 resilient stocks with low risk scores that filters for resilience when markets turn choppy.
- Zero in on financial strength and scan a list of solid balance sheet and fundamentals (24 results) that focuses on robust fundamentals and cleaner balance sheets.
- Chase potential mispricings early and comb through a 9 elite penny stocks with strong financials that highlights select smaller companies with stronger profiles.
Have feedback on this article? Concerned about the content? Get in touch with us directly. Alternatively, email editorial-team@simplywallst.com