
How Investors May Respond To CNB Financial Stock Q3 Earnings Growth
- CNB Financial reported Q3 2026 net interest income of US$76.31 million and net income of US$28.06 million, with higher figures also posted for the nine month period ended September 30, 2026 compared with the prior year.
- The bank paired stronger earnings with higher net loan charge offs of US$2.353 million in Q3 2026, highlighting the balance between profitability and credit costs in its current business mix.
- This article examines how CNB Financial's stronger Q3 and year to date earnings shape the broader investment narrative around the bank.
Compare CNB Financial's latest earnings and credit trends with hand-picked regional bank peers, screened for balance sheet strength using our list of solid balance sheet and fundamentals (24 results), to see how its profile stacks up.
CNB Financial Investment Narrative Recap
To own CNB Financial, you need to be comfortable with a community bank that leans into commercial and industrial lending and treasury management for its earnings engine. The recent Q3 report showed higher net interest income and net income, which supports that thesis. The short term swing factor remains how effectively CNB Financial can keep its net interest margin steady while competition for deposits and loan demand both stay in focus.
The biggest near term risk is credit. Net loan charge offs increased to US$2.353 million in Q3 2026 compared with a year earlier, which puts more attention on portfolio quality, especially in business lending and commercial real estate. If that trend stays modest, the latest results do not radically change the core story, but they raise the bar for risk monitoring.
The most relevant update here is the Q3 2026 earnings announcement. CNB Financial reported net interest income of US$76.31 million and net income of US$28.06 million for the quarter, with higher figures also reported for the nine month period. For shareholders, this keeps the focus on how the bank converts its regional footprint and ESSA Bank integration into consistent profitability and an efficiency ratio that stays competitive.
Those same numbers sit beside rising net charge offs, which ties straight back to the key risk around expanding commercial exposure. Investors paying attention to catalysts will likely track how management addresses credit quality on the October 29 earnings call, how reserve levels and underwriting terms respond to recent loss experience, and whether loan growth in higher yielding segments is matched by cautious risk controls.
What The Analyst Framework Implies For CNB Financial
Analysts sketch a fairly steady revenue line for CNB Financial over the next few years, with the heavier lifting coming from margin expansion. Profitability today is framed around a 27.6% profit margin and earnings of US$91.0 million. The consensus view points to profit margins rising to 40.2% and earnings reaching US$133.6 million by 2029, which would mean roughly a 47% earnings increase from the current base if those projections play out.
CNB Financial's narrative projects US$332.6 million revenue and US$133.6 million earnings by 2029. This assumes fairly flat yearly revenue and roughly a US$42.6 million earnings increase from US$91.0 million today.
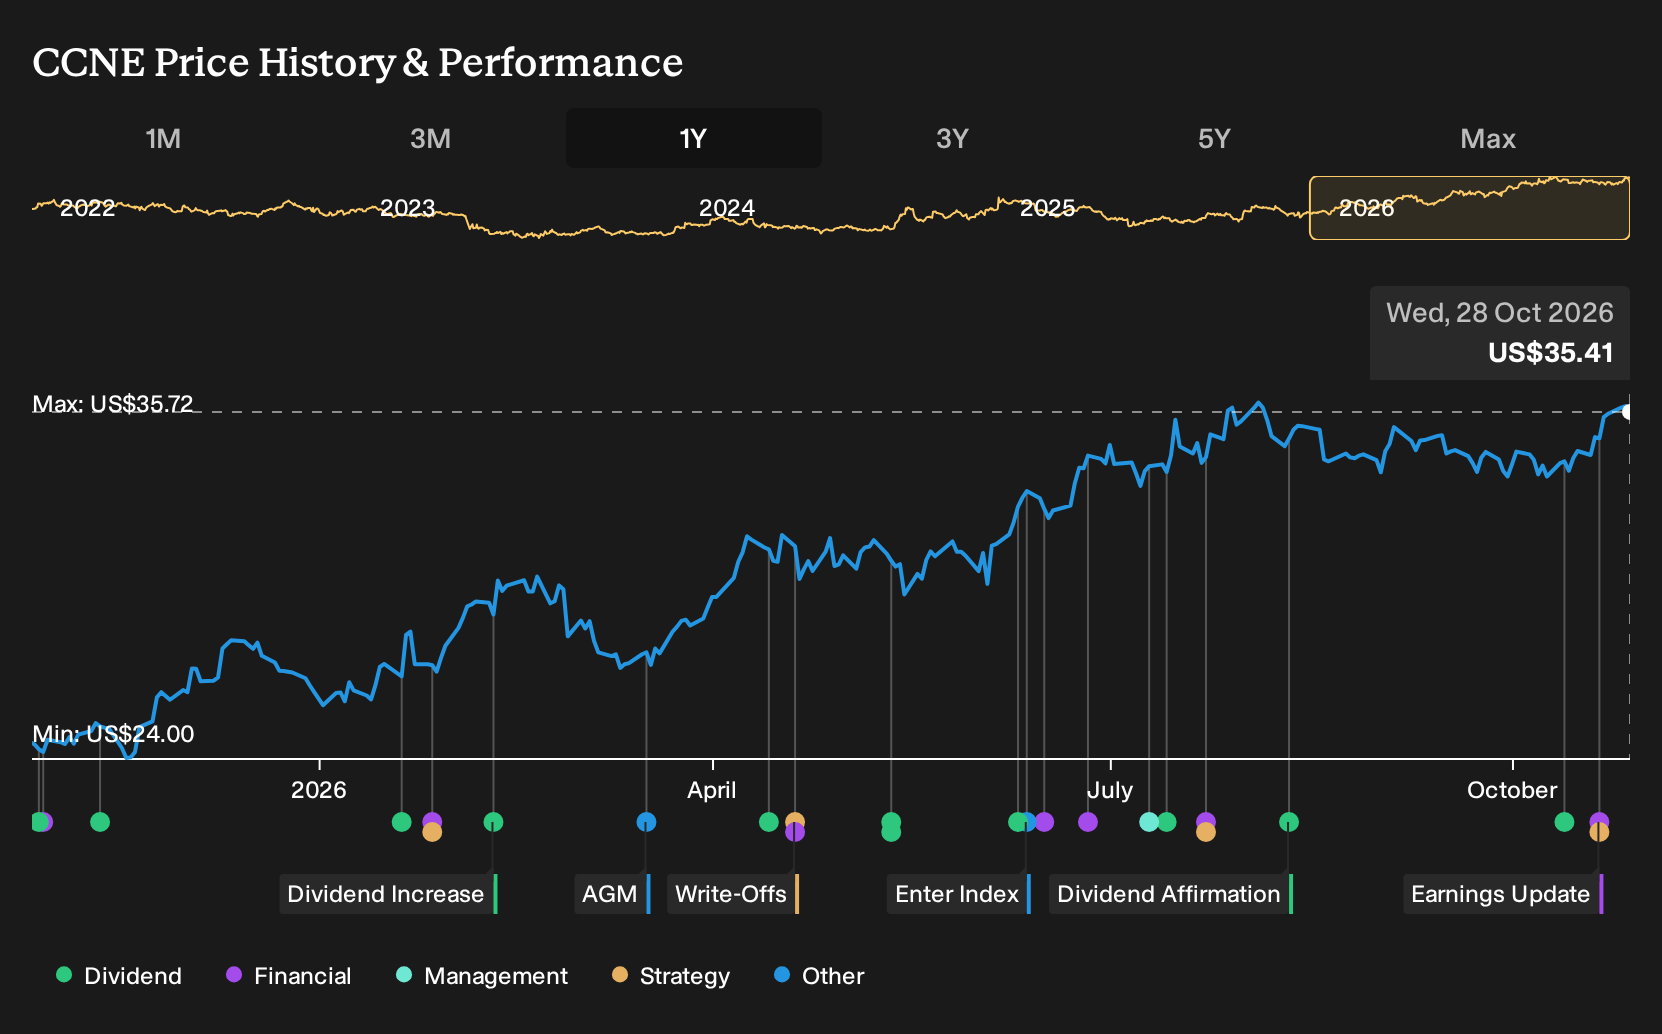
That earnings profile underpins the analyst price target mechanics. The group of covering analysts centers on a US$37.50 target price, only modestly above the recent US$35.14 share price. To line up with that framework, an investor would need to accept a 2029 earnings figure of US$133.6 million, revenue of US$332.6 million and a P/E that eases from 11.3x today to 10.2x on those projected earnings, using a discount rate in the low 7% range.
The implied de rating from 11.3x to 10.2x puts more of the heavy lifting on earnings growth rather than multiple expansion. That structure can appeal to investors who prefer a higher share of expected return to come from underlying profit rather than shifts in market sentiment toward the stock. It also means any disappointment in earnings delivery would have a fairly direct impact on how the valuation stacks up against the analyst framework.
Flat revenue assumptions paired with higher margins tell you where expectations are concentrated. The forward picture is less about CNB Financial rapidly scaling its top line and more about extracting more earnings from roughly the same revenue base through better mix, cost control and funding discipline. For a regional bank leaning into commercial and industrial loans and treasury services, that puts a spotlight on pricing power, deposit costs and integration benefits from ESSA rather than pure volume growth.
- If funding costs rise faster than expected, the path from a 27.6% to 40.2% profit margin becomes harder to achieve.
- If credit losses stay manageable, the projected improvement in margins and earnings becomes easier to sustain.
- If ESSA integration benefits and efficiency gains stall, the valuation case that relies on higher profitability rather than strong revenue growth comes under more pressure.
For readers comparing CNB Financial to other regional banks, the key difference in this setup is the reliance on margin expansion over headline revenue growth. The analyst model asks whether this community bank, with its focus on commercial clients and treasury relationships, can steadily improve profitability while holding the line on credit quality and deposit costs. How investors answer that question will likely shape how they interpret the relatively tight gap between the current share price and the consensus target.
Uncover how CNB Financial's fair value indicates a 6% potential upside to its current price, which may not last much longer.
Exploring Other Perspectives
Fair value estimates for CNB Financial from three members of the Simply Wall St Community span roughly US$37.50 to about US$81.48, so some retail investors see limited upside while others pencil in far higher potential. When you set that against rising net loan charge offs and the upcoming October 29 earnings call, you have a fresh set of credit questions and management commentary that could shift how you and other investors frame those opinions. Investor views can differ widely, so it is worth exploring several of these alternative perspectives before deciding where you land.
Explore 2 other CNB Financial fair value estimates, including one that suggests it could be worth just $37.50.
Reach Your Own Conclusion
Don't just follow the ticker. Dig into the data and build a conviction that's truly your own.
- A great starting point for your CNB Financial research is our analysis highlighting 5 key rewards that could impact your investment decision.
- See our latest analysis for CNB Financial. The report includes a comprehensive fundamental analysis summarized in a single visual, the Snowflake, making it easy to evaluate CNB Financial's overall financial health at a glance.
Looking For More Investment Ideas Beyond CNB Financial?
If CNB Financial helps frame what you want from a regional bank, you can use that as a template and broaden your watchlist with other stocks that match your preferred mix of quality, income and resilience through the Simply Wall St Screener.
- For investors who want potential bargains with strong underlying fundamentals, scan a curated set of 26 high quality undervalued stocks that may warrant a closer look.
- If reliability matters most to you, focus on resilience first by checking out a group of 32 resilient stocks with low risk scores that score well on capital strength and volatility.
- When you want to uncover lesser known opportunities with solid financial footing, work through a hand picked pool of 19 high quality undiscovered gems that the market may not be fully pricing in yet.
Have feedback on this article? Concerned about the content? Get in touch with us directly. Alternatively, email editorial-team@simplywallst.com