
Preformed Line Products (PLPC) Earnings Put Valuation Questions Back In Focus
Preformed Line Products (PLPC) just released third quarter 2026 results, giving investors fresh numbers to assess the stock. The report covers both the latest quarter and the first nine months of the year.
The fresh earnings update comes after a sharp pullback, with the 30 day share price return down 22.38% and the stock falling 8.14% in the last session. This is occurring even as the year to date share price return stands at 51.18% and the 5 year total shareholder return is 378.10%, which highlights long term momentum that contrasts with recent weakness and suggests a change in how near term risk is being evaluated.
Scan how Preformed Line Products compares to other power and infrastructure plays by reviewing the hand-picked 43 power grid technology and infrastructure stocks in the same corner of the market.
Bulls point to Preformed Line Products’ strong recent earnings, while bears highlight the sharp pullback and question how much good news is already priced in. Which side does the current valuation reward?
Price-to-Earnings of 36.3x: Is it justified?
On simple earnings terms, Preformed Line Products is priced at a P/E of 36.3x, while the last close sits at $320.40, and that points to investors paying a premium compared to both peers and an internally estimated fair ratio.
The P/E ratio compares the current share price to earnings per share and helps you see how much the market is willing to pay for each dollar of profit. For a power and infrastructure supplier like Preformed Line Products, that figure often reflects how durable investors believe its cash flows and order pipeline could be.
Here, the stock trades on a richer P/E than the peer average of 34.7x and the broader US Electrical industry at 35.3x, which signals the market is assigning a higher tag to its earnings than comparable businesses. Against an estimated fair P/E of 25.4x, that premium looks even starker and suggests the multiple could have more room to compress than expand if sentiment or forecasts shift.
Explore the SWS fair ratio for Preformed Line Products.
Result: Price-to-Earnings of 36.3x (OVERVALUED)
Still, the sharp 22.4% 30 day slide and a richer P/E leave Preformed Line Products exposed if earnings momentum cools or investor enthusiasm fades.
Find out about the key risks to this Preformed Line Products narrative.
Another View: What The DCF Model Says About Preformed Line Products
A different lens tells a very different story. Our DCF model points to a future cash flow value of $67.53 per share for Preformed Line Products, while the stock trades at $320.40. That gap implies the shares are priced well above this cash flow based estimate. Which yardstick do you trust more when real money is on the line?
Look into how the SWS DCF model arrives at its fair value.
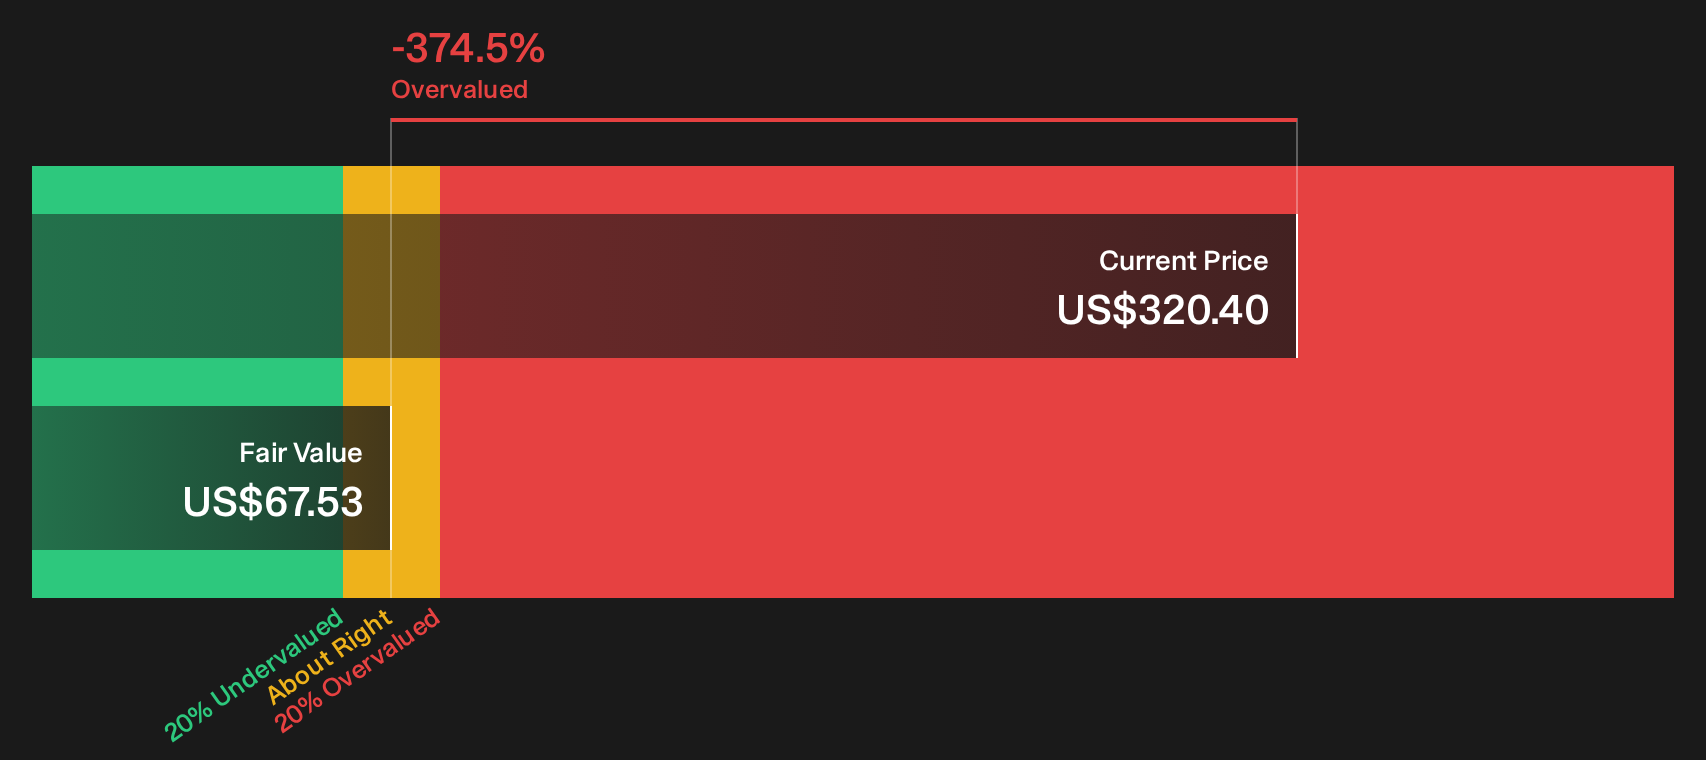
Simply Wall St performs a discounted cash flow (DCF) on every stock in the world every day (check out Preformed Line Products for example). We show the entire calculation in full. You can track the result in your watchlist or portfolio and be alerted when this changes, or use our stock screener to discover 28 high quality undervalued stocks. If you save a screener we even alert you when new companies match - so you never miss a potential opportunity.
Next Steps
If this mix of concern and optimism around Preformed Line Products feels conflicting, take it as a signal to review the underlying metrics yourself. To weigh both sides of the debate in one place, start with the 1 key reward and 2 important warning signs.
Looking for more investment ideas beyond Preformed Line Products?
You do not need to stop with Preformed Line Products. Use the Simply Wall St Screener to surface fresh opportunities before they move out of reach.
- Target potential bargains by scanning companies that combine quality fundamentals with attractive valuations through the 28 high quality undervalued stocks.
- Build a steadier income stream by focusing on resilient payers using the 6 dividend fortresses.
- Prioritise financial strength by concentrating on businesses with robust balance sheets via the list of solid balance sheet and fundamentals (23 results).
Have feedback on this article? Concerned about the content? Get in touch with us directly. Alternatively, email editorial-team@simplywallst.com