
Amarin (AMRN) Q3 Earnings Reveal A Profit Turn Built On Cost Cuts
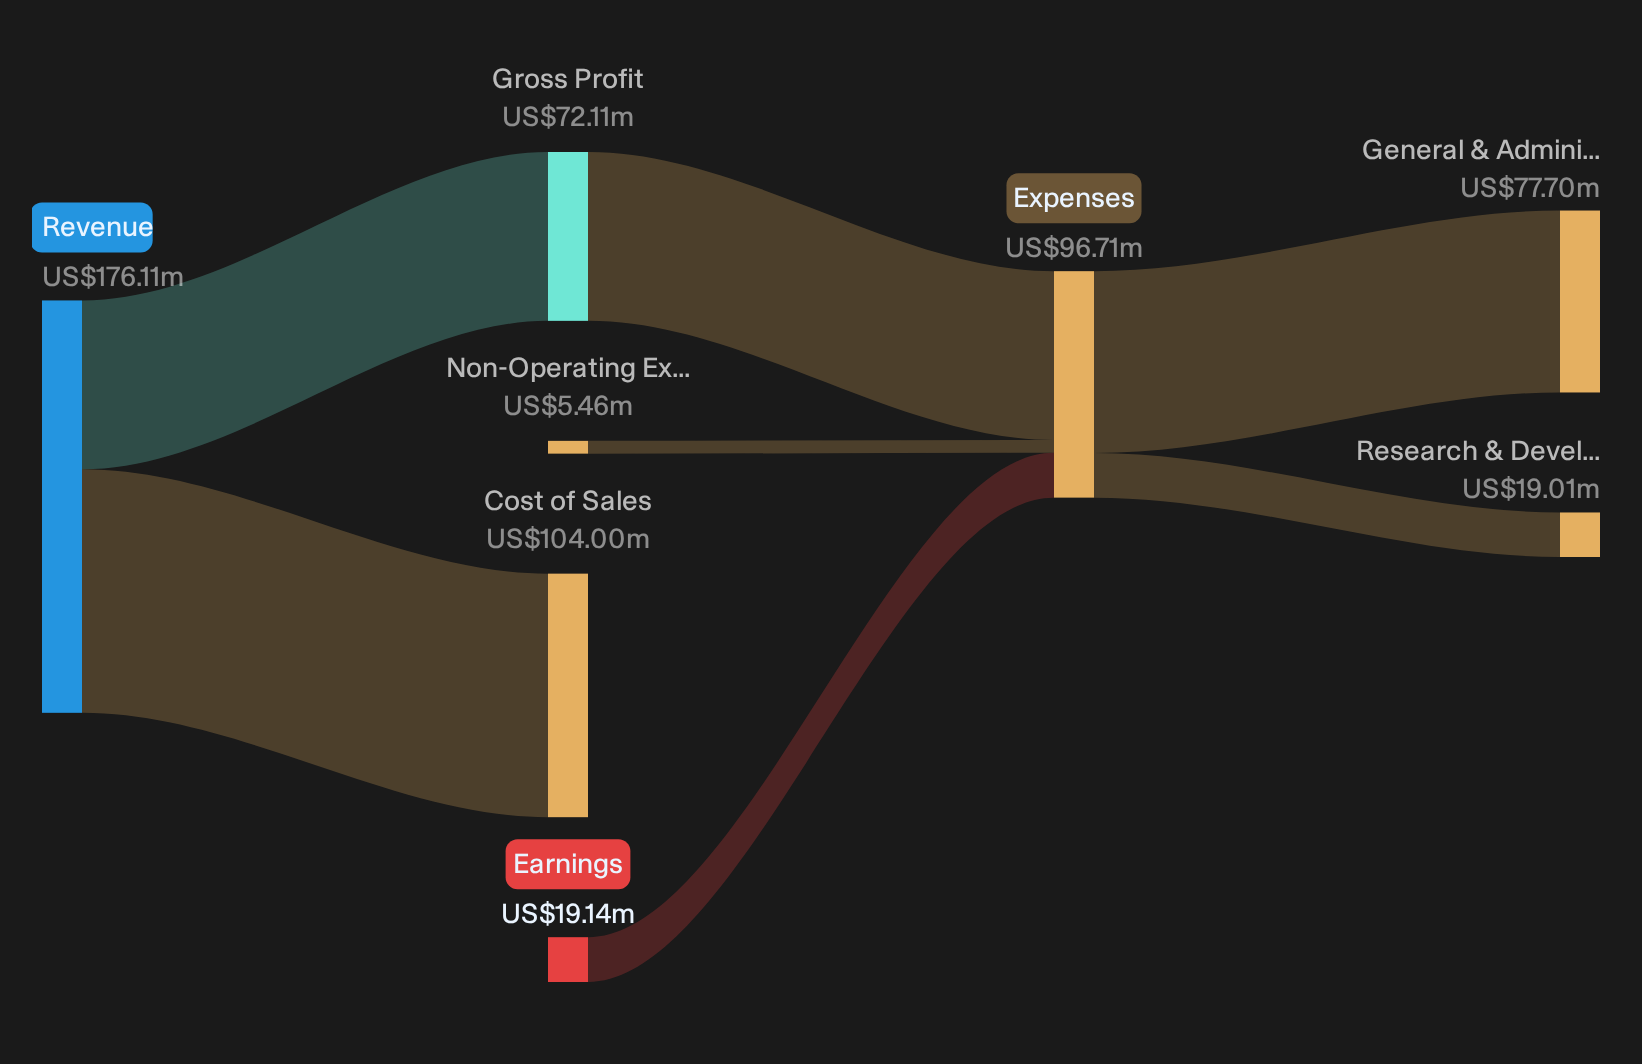
Amarin came into this Q3 2026 print as a restructuring story with a bruised share price and a valuation that screened cheap on sales. The stock barely budged, up just 0.04% to US$12.76, which suggests investors shrugged at the news. The headline result was anything but sleepy. Management delivered a rare profit, with roughly US$39.6 million in revenue and net income nudging into positive territory, helped by a slimmer cost base. That quiet price move now sits alongside a quarter that puts the margin turnaround, rather than top line pressure, at the center of the Amarin debate.
Love the cleaner Amarin cost base but worried that margin repair stories can stall out? Check out our screener of resilient balance sheet plays through the list of solid balance sheet and fundamentals stocks (22 results)
Q3 2026 Earnings Summary
- Revenue (Q3 2026 vs Q3 2025): US$39.6 million vs. US$49.7 million (decline of about 20%)
- Net Income / Loss (Q3 2026 vs Q3 2025): Net income of US$0.245 million vs. net loss of US$7.7 million (swing to a small profit)
- Basic EPS (Q3 2026 vs Q3 2025): US$0.01 per share vs. loss of US$0.37 per share (return to roughly breakeven EPS)
- Total Operating Expense (Q3 2026 vs Q3 2025): Down 44% year on year, with operating costs cut sharply following restructuring
Ask Charlie what Amarin’s cancer trial means for VASCEPA’s future.
Amarin bull case: partners, guidelines and cost reset
Optimists argue Amarin’s ex U.S. push and leaner structure can convert guideline wins into steadier earnings power.
"International partnerships and expanding global demand offset U.S. challenges, while operational improvements and a strong balance sheet enhance financial stability and growth potential."
Q3 gives partial support. Product revenue in the U.S. fell, yet licensing and royalty income more than doubled to US$2.7 million and in market demand in Europe and Rest of World grew strongly. A 44% drop in operating expense and four straight quarters of positive operating cash flow show the cost and balance sheet parts of this bullish story are tracking to plan.
Amarin bear case: dependence on a single product and partners
The worry is that Amarin’s reliance on one drug and overseas distributors leaves earnings fragile.
"Single product concentration and shift to royalty revenue heighten earnings unpredictability and exposure to generics and competitive pressures."
Q3 underlines that concern. Total net revenue declined about 20% year on year, driven by U.S. pricing pressure from generic rivals even as prescription volume held roughly stable. International in market demand grew, but reported partner revenue lagged because of ordering patterns, which shows how a royalty and milestone model can make quarterly sales choppy. A slim US$0.245 million profit rests heavily on reduced operating costs rather than broad based top line strength, so earnings still lean on tight execution.
That disagreement has a full argument behind it. → Uncover the lower Fair Value this Narrative argues for.
Hunt For Quiet Earnings Disconnects
Amarin just showed how a cleaner cost base can change the earnings story without moving the share price much. The real opportunity is hunting for companies that could be undervalued before the market adjusts.
- Company 1 - 46% below our estimate - turns a vast social attention engine into an AI system that predicts user purchases.
- Company 2 - 20% below our estimate - builds a broad cardiometabolic and obesity treatment portfolio dependent on incretin therapy access and capacity.
- Company 3 - 21% below our estimate - pushes deeper adoption of surgical robotics and smart care tools as hospitals upgrade equipment.
That is three of the list. See the full list of 30 companies trading below our fair value estimates →
Have feedback on this article? Concerned about the content? Get in touch with us directly. Alternatively, email editorial-team@simplywallst.com