
IGO (ASX:IGO) Just Drew Fresh Attention, So What Is The Market Weighing?
Conference spotlight puts IGO’s battery minerals mix in focus
IGO (ASX:IGO) stepped into the spotlight at the IMARC 2026 conference in Sydney, highlighting its mix of nickel and lithium assets and ongoing spodumene and lithium hydroxide production for electric vehicle and energy storage supply chains.
That conference focus on future-facing metals has sharpened attention on a harder question for investors. How resilient can IGO’s project revenues be if a single pressure point in its portfolio or contracts shifts against expectations?
IGO’s conference appearance comes after a sharp reset in sentiment, with the share price down about 20% over 30 days and 36% year to date. The 1-year total shareholder return decline of 4.5% signals pressure on longer term holders, despite a recent uptick in short term share price momentum.
Scan beyond IGO and compare its battery minerals story with a curated list of 33 best rare earth metal stocks that could react quickly to the same EV and storage themes.
IGO shares have fallen hard while analyst targets and intrinsic value estimates still sit meaningfully higher. Where does a fair valuation actually land in that gap?
Price-to-earnings of 27.3x for IGO: Is it justified?
IGO is trading on a P/E of 27.3x while the share price closed at A$5.25, which points to investors paying a premium compared to both peers and the wider Australian Metals and Mining group.
The P/E ratio compares what the market is willing to pay today for each dollar of current earnings. For a miner like IGO that is exposed to battery minerals, a higher P/E usually signals that investors are building in expectations of stronger profit power or more resilient margins than the sector average.
Here the premium is clear. IGO’s 27.3x P/E is more than double the 11.1x average for the Australian Metals and Mining industry, and it also sits above the peer average of 20.8x. The estimated fair P/E of 16.8x is materially lower again, which suggests the level investors could move towards if sentiment cools and earnings forecasts or risk appetite reset closer to that fair ratio.
Explore the SWS fair ratio for IGO.
Result: Price-to-earnings of 27.3x (OVERVALUED)
Still, IGO’s story can be knocked off course if sentiment on battery minerals weakens further, or if project execution at Nova or Cosmos disappoints.
Find out about the key risks to this IGO narrative.
Another view on IGO’s value
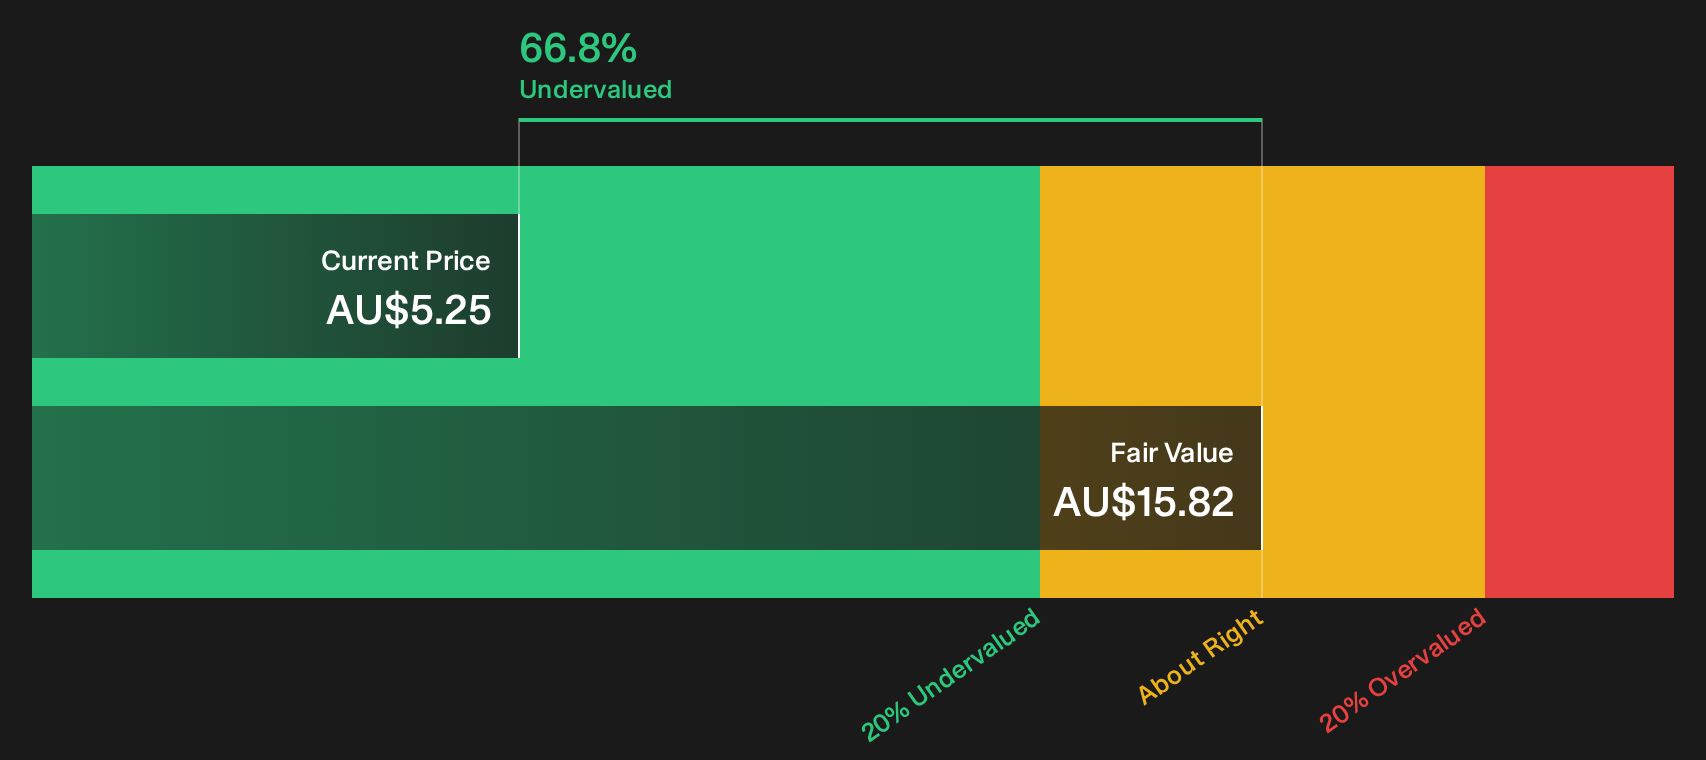
The P/E premium paints IGO as expensive, yet the SWS DCF model points in the opposite direction. On that approach, the shares at A$5.25 sit about 66.8% below an estimated future cash flow value of A$15.82, which frames current pricing as heavily discounted rather than stretched.
That gap between earnings based multiples and cash flow assumptions is wide. It raises a simple question for investors. Which signal deserves more weight when sentiment on battery minerals is already fragile, the headline P/E or the longer term cash flow story that the DCF is leaning on?
Look into how the SWS DCF model arrives at its fair value.
Simply Wall St performs a discounted cash flow (DCF) on every stock in the world every day (check out IGO for example). We show the entire calculation in full. You can track the result in your watchlist or portfolio and be alerted when this changes, or use our stock screener to discover 2 high quality undervalued stocks. If you save a screener we even alert you when new companies match - so you never miss a potential opportunity.
Next Steps
Mixed messages on IGO’s value and risk profile can feel unsettling. Consider acting promptly, reviewing the data yourself, and weighing the 3 key rewards and 1 important warning sign.
Looking for more IGO investment ideas?
If IGO has sharpened your focus on where risk and reward really meet, do not stop here. Broader ideas can change how you position your next move.
- Target potential mispricing by checking a curated group of companies screened as 2 high quality undervalued stocks that may offer stronger value than headline P/E ratios suggest.
- Build a steadier income stream by reviewing stocks in the 4 dividend fortresses that focus on higher yields with an emphasis on resilience.
- Protect your downside first by scanning the 6 resilient stocks with low risk scores and concentrating on businesses filtered for more durable financial profiles.
Have feedback on this article? Concerned about the content? Get in touch with us directly. Alternatively, email editorial-team@simplywallst.com