
ePlus (PLUS) Earnings Near, Is The Stock Still A Bargain?
Upcoming earnings set the stage for ePlus
ePlus (PLUS) is back on investor calendars, with the company set to release results for the quarter and six month period ended September 30, 2026, after markets close on November 5.
Recent trading hints at steady interest in ePlus, with a 1-month share price return of 6.09% and year to date share price return of 10.21% at a last close of $95.49. The 1-year total shareholder return of 32.14% points to stronger momentum over a longer stretch.
Scan how ePlus stacks up against other potential breakouts in a curated list of 18 high quality undiscovered gems across the tech space and beyond.
ePlus has delivered solid growth in both revenue and net income, and the share price has tracked that strength with a 1-year total return above 30%. The real puzzle now is whether that performance is already fully reflected in today’s $95.49 price.
Most Popular Narrative: 14% Undervalued
On the prevailing narrative, ePlus carries an implied fair value of $111 against a last close of $95.49. This frames earnings season against a modest valuation gap built on analyst forecasts and cash flow assumptions.
Persistent demand for AI powered infrastructure, security, and cloud solutions across industries is expected to accelerate, and ePlus's focused investments in AI consultative capabilities and AI related plumbing in compute, networking, and security, together with open orders above US$1.5b that management expects to convert mainly in the back half of the year and beyond, give the company a pipeline that can support future revenue and earnings growth.
See why 1 investors see ePlus as 14% undervalued.
Result: Fair Value of $111 (UNDERVALUED)
Still, the bullish ePlus story depends on security and services margins stabilising, and on delayed professional services projects not dragging on longer than management anticipates.
Find out about the key risks to this ePlus narrative.
Another View: ePlus Through The Cash Flow Lens
The first story around ePlus leans on an implied fair value of $111, built from analyst earnings and multiples. A very different answer comes from the Simply Wall St DCF model, which puts future cash flow value at $60.38, implying the stock trades well above that mark.
This gap leaves investors weighing two pictures. One is an earnings driven case that treats current pricing as modestly cheap. The other is a cash flow view that reads ePlus as expensive. Which yardstick you trust more will shape how you interpret the next set of results.
Look into how the SWS DCF model arrives at its fair value.
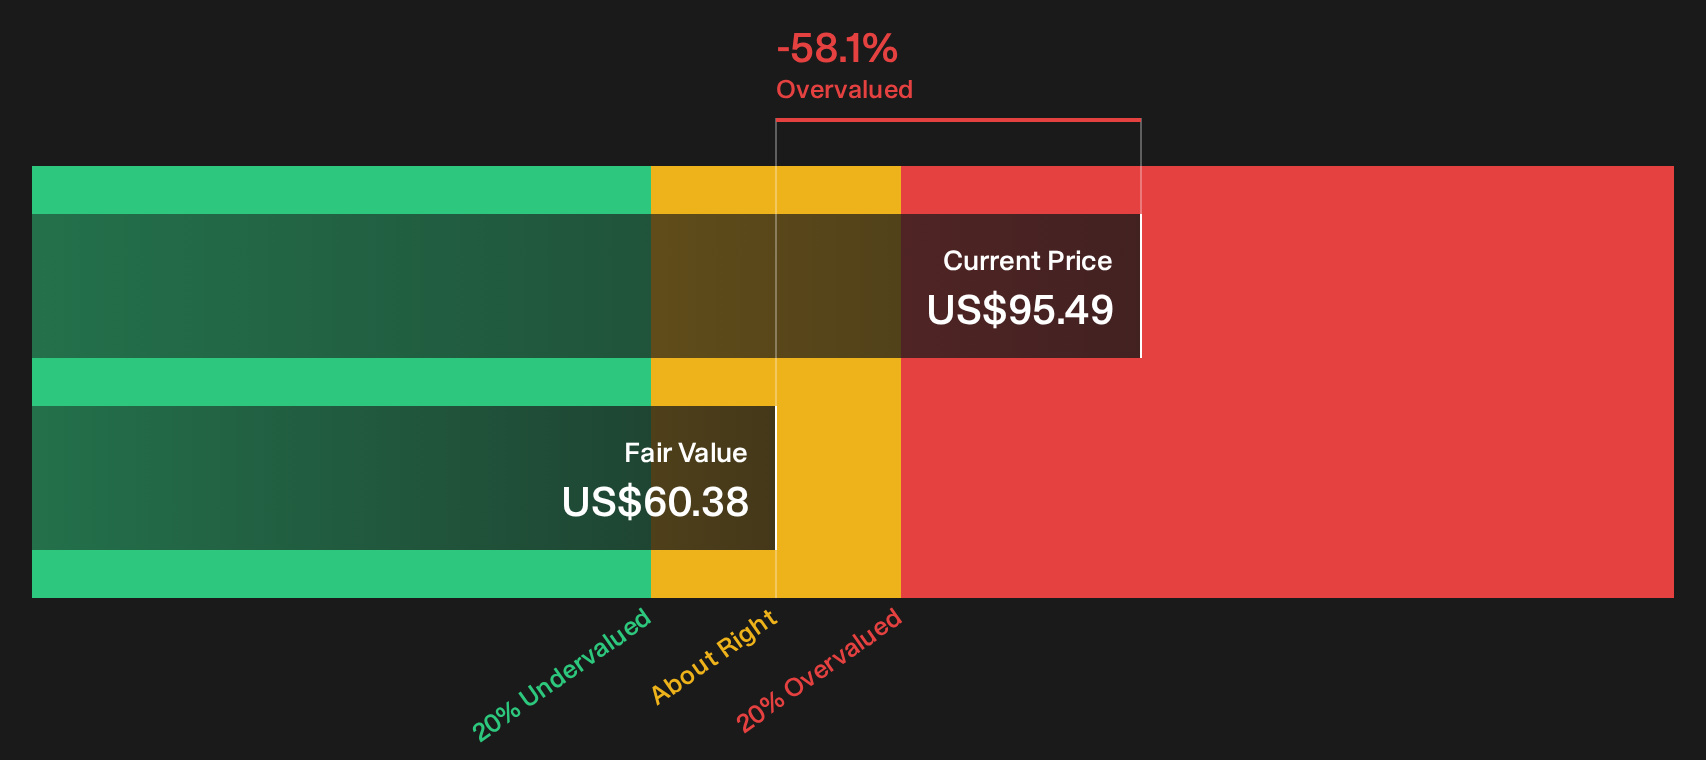
Simply Wall St performs a discounted cash flow (DCF) on every stock in the world every day (check out ePlus for example). We show the entire calculation in full. You can track the result in your watchlist or portfolio and be alerted when this changes, or use our stock screener to discover 30 high quality undervalued stocks. If you save a screener we even alert you when new companies match - so you never miss a potential opportunity.
Next Steps
Plenty in this ePlus story points to optimism, yet the split between earnings and cash flow views leaves real work for you to do. Move fast, pull up the detailed breakdown, and weigh the 3 key rewards.
Ready to act on your next idea beyond ePlus?
Do not stop with ePlus. Broaden your watchlist across sectors and risk levels so you always have fresh candidates ready when conditions line up.
- Target value hunters who want quality at a sensible entry point by scanning a focused set of 30 high quality undervalued stocks.
- Prioritise resilience and capital preservation by filtering for companies in the 30 resilient stocks with low risk scores that keep risk scores in tighter ranges.
- Stack your portfolio with resilient payers by searching through 7 dividend fortresses built around higher yield income ideas.
Have feedback on this article? Concerned about the content? Get in touch with us directly. Alternatively, email editorial-team@simplywallst.com